A scientific report template to edit can turn a demanding research-writing task into a much more manageable workflow. Instead of starting with a blank page, you begin with a logical structure that already separates the title, abstract, introduction, methods, results, discussion, references, and supporting material. The template does not replace scientific judgment, but it gives that judgment a clear place to appear.
Scientific reports are used across laboratory science, engineering, environmental research, health sciences, psychology, education, and many other fields. Their exact requirements vary by discipline, institution, assignment, and publication venue, but the familiar Introduction, Methods, Results, and Discussion pattern remains common for empirical work. A good template therefore needs to be flexible rather than rigid.
The best approach is to treat a template as a controlled framework. You should be able to change headings, add or remove subsections, insert tables and figures, record methodological details, and adapt references without damaging the underlying structure. This is especially useful when the same research needs to exist in several forms, such as a student submission, a supervisor draft, an internal report, and a manuscript prepared for publication.
This guide explains how to choose and use a scientific report template, how to adapt one for Word, PDF, Google Docs, or spreadsheet-based workflows, and how to make sure the finished document remains scientifically useful. It also covers data collection, analysis, figures, citations, revision, common mistakes, and practical ways to turn a basic template into a professional research document.
The goal is not simply to make a report look organized. The goal is to make the research easier to understand, check, reproduce, evaluate, and communicate. That distinction matters because visual formatting can improve readability, but only accurate methods, transparent data, appropriate analysis, and defensible conclusions make a scientific report trustworthy.

Source: La Vérité
What Is a Scientific Report Template to Edit?
A scientific report template is a pre-organized document framework designed for presenting research in a consistent sequence. An editable version normally contains headings, placeholder fields, tables, formatting conventions, and other structural elements that can be changed to suit the study. The important distinction is that the template provides organization while the researcher supplies the actual evidence, interpretation, and conclusions.
A useful template should make the purpose of each section obvious. The introduction establishes the problem and research question, the methods explain how the work was performed, the results present the findings, and the discussion interprets what those findings mean. Many reports also include an abstract, conclusion, references, appendices, figures, tables, or supplementary material depending on the assignment or publication requirements.
For empirical research, the IMRaD structure is particularly important. Universities including George Mason University, the University of Wisconsin–Madison, Utah Valley University, KTH, and other academic writing centers describe Introduction, Methods, Results, and Discussion as a common structure for scientific and laboratory reports. The precise arrangement can still differ by discipline, so a template should always be adapted to the applicable instructions.
An editable framework is valuable because research rarely fits a generic form perfectly. A chemistry experiment may need reagent and instrument details, a field study may need sampling locations and environmental conditions, a psychology study may require participant information and ethics procedures, and a computational study may need software versions, datasets, algorithms, and validation procedures.
The strongest template is therefore not the one with the most decorative formatting. It is the one that helps the writer answer the reader’s questions in the correct order: What problem was investigated? Why does it matter? What was done? What was found? How reliable are the findings? What do they mean? What should happen next?
Why Use an Editable Scientific Report Framework?
Starting from a blank document creates unnecessary decisions. The writer has to decide where the abstract belongs, how headings should be formatted, how figures should be labeled, how tables should be introduced, and how references should be organized. Those decisions can distract from the more important task of constructing a clear scientific argument.
An editable framework reduces that cognitive load. Once the basic document architecture is established, the writer can focus on research content. This is particularly helpful when several reports must follow the same institutional or laboratory conventions because the same heading hierarchy and formatting rules can be reused across projects.
Templates also improve consistency. If every experiment has a clearly labeled methods section, every figure has a number and explanatory caption, and every result is connected to the appropriate analysis, supervisors and readers can navigate the document more efficiently. Consistency is especially valuable when reports are reviewed by several people.
Another benefit is revision control. A well-designed document can include clearly marked fields for the study title, author information, version date, research question, dataset, analysis method, and status of review. Those fields make it easier to distinguish an early draft from a version that has been checked for submission.
However, a template should never become a mechanical checklist that forces inappropriate sections into every study. Scientific writing guides emphasize that report structures vary across disciplines and research designs. A field study, case study, systematic review, or computational project may require a different organization from a controlled laboratory experiment.

Source: BioAxion Innovations
Core Structure of a Scientific Report Format Template
A practical scientific report format template usually begins with the report title and author information. The title should identify the subject of the investigation precisely enough that a reader can understand what was studied. Avoid vague titles such as “Science Experiment” when a more informative description can identify the variable, population, material, system, or relationship under investigation.
The abstract comes next in many formal reports. It should provide a compact overview of the study rather than a general introduction to the topic. A useful abstract normally identifies the purpose or research question, briefly describes the approach, summarizes the principal findings, and states the main conclusion or implication. Because the abstract represents the report as a whole, it is often easiest to write or finalize it after the main sections are complete.
The introduction provides context and explains why the investigation was necessary. A strong introduction usually moves from a broader scientific problem toward the specific question being addressed. It may summarize relevant literature, define important concepts, identify a knowledge gap, state the objective, and present a hypothesis where appropriate.
The methods section describes how the research was conducted. It should provide enough information for a competent reader to understand the research design and, where appropriate, reproduce the work. Details may include participants or samples, materials, instruments, settings, procedures, measurements, controls, data processing, statistical methods, and ethical considerations.
The results section reports what the study found. Tables, graphs, images, equations, and statistical outputs can be useful here, but each should serve a clear purpose. The discussion then interprets those findings, relates them to the research question and existing evidence, considers limitations, and explains the significance of the results. References and appendices complete the document when required.

Source: Yomu
Title Page and Front Matter
The title page should contain only information that helps identify the report. Depending on the context, this may include the title, author or authors, institution, course or laboratory, supervisor, submission date, project identifier, and version information. A professional report does not need a visually complicated cover page if the institution or journal has a simpler convention.
For student work, the title page can also help establish academic context. Course code, section, instructor, student identification details, and laboratory group may be appropriate where required. These fields should follow the assignment instructions rather than being added automatically because they appear in another template.
For professional or research-group reports, version control can be more useful than decorative design. A small document-control block can record the report version, date, author, reviewer, and status. This is particularly valuable when several people are revising the same study or when results may change as additional experiments are completed.
Publication manuscripts require even greater discipline. A journal may request a title page, author affiliations, corresponding-author information, acknowledgments, declarations, keywords, graphical abstracts, highlights, or other elements. These requirements differ substantially between publishers and journals, so a generic scientific template should not be treated as a substitute for the target journal’s author instructions.
The front matter should also avoid claims that have not yet been demonstrated. For example, a title should not imply a causal relationship if the study only demonstrates an association. Precision in the title helps establish an accurate scientific tone from the first page and prevents the rest of the report from having to correct an exaggerated opening claim.

Source: Hindustan Times
Writing the Introduction
The introduction is where the report establishes its scientific problem. A useful approach is to move from known information toward the precise question addressed by the study. The opening should provide enough context to orient the reader, but it should not become a long literature review that delays the actual purpose of the investigation.
Begin by identifying the broader topic and why it matters. Then introduce the specific phenomenon, population, material, process, or relationship being investigated. Relevant previous research should be used selectively to establish what is already known and where uncertainty remains.
The next step is to define the research gap or practical problem. The gap does not always mean that nobody has ever studied the subject. It can involve a population that has not been examined, a method that has not been tested under particular conditions, conflicting findings, an unresolved mechanism, or a measurement problem.
End the introduction with a clear objective or research question. If the study tests a hypothesis, state it in a way that can be evaluated using the chosen design. The objective should align with the methods and results; a report becomes difficult to follow when the introduction asks one question but the analysis answers another.
When editing a scientific report template, reserve enough space for this logical progression. A template should encourage the writer to connect background, evidence, gap, objective, and hypothesis rather than simply providing a large empty text box labeled “Introduction.” Structure can improve scientific reasoning when it reflects the logic of the research itself.

Source: Lumoral
Building a Strong Methods Section
The methods section is one of the most important parts of a scientific report because it allows readers to understand exactly how evidence was produced. Academic writing guidance commonly emphasizes sufficient detail for replication or meaningful evaluation. The correct level of detail depends on the discipline, but important methodological decisions should not be hidden.
Start by identifying the research design. State whether the work involved an experiment, observational study, survey, field investigation, simulation, secondary-data analysis, qualitative study, or another design. Then describe the population, sample, materials, instruments, or datasets relevant to that design.
Describe procedures in a logical order. Include information that could affect the interpretation of the results, such as sampling criteria, controls, calibration, measurement conditions, timing, treatment levels, environmental conditions, or data-cleaning decisions. If a standard procedure was followed exactly, an appropriate reference may sometimes be sufficient; if it was modified, explain the modification.
Methods should distinguish planned procedures from what actually happened. If an experiment deviated from the original protocol, the report should state that clearly rather than silently rewriting the procedure to make the study appear cleaner. Transparent reporting is more valuable than an artificially perfect narrative.
For data analysis, identify the variables, transformations, statistical tests, models, or computational procedures used. Avoid listing software names without explaining what the software was used to do. A reader needs to understand the analytical logic, not merely the name of a program.

Source: Frontiers
Data Collection and Research Documentation
Good reports begin with good records. A scientific report is much easier to write when raw observations, sample identifiers, dates, instrument settings, deviations, calculations, and decisions have been documented during the research rather than reconstructed from memory at the end.
A laboratory notebook, electronic research notebook, structured spreadsheet, or database can serve as the working record. The exact system varies by laboratory and discipline, but the underlying principle is the same: important research information should be recorded in a form that remains understandable after the experiment is finished.
Data collection forms should separate raw observations from later interpretation. For example, if a researcher records temperature measurements, the original measurements should remain identifiable even after averages, conversions, exclusions, or derived variables are created. This separation makes it easier to audit calculations and identify where an unexpected result originated.
File naming also matters. A project with files named “final,” “final2,” “newfinal,” and “reallyfinal” is difficult to manage. More useful naming conventions identify the study, dataset, date, version, or analysis stage. Consistent folder structures can further reduce confusion when multiple researchers work on the same project.
Documentation should also preserve decisions. If observations were excluded, explain why. If a measurement instrument was recalibrated, record when and how. If a statistical model was changed after exploratory analysis, distinguish exploratory reasoning from confirmatory testing. Such records make the eventual report more credible and make future revisions substantially easier.

Source: 3BL Media
How to Present Results Clearly
The results section should answer a straightforward question: what did the study find? It should present evidence systematically without turning every observation into an interpretation. The distinction between reporting results and discussing their meaning is one of the most important habits in scientific writing.
Begin with the findings most directly connected to the research question. If several experiments were conducted, organize the results in a logical sequence rather than simply following the order in which the experiments happened. The order may be chronological, but it can also move from primary outcomes to secondary outcomes or from simple analyses to more complex ones.
Tables are useful when readers need to compare exact values across many observations. Graphs are usually better when the important feature is a trend, relationship, distribution, or comparison. A table and graph should not automatically present the same information because duplication consumes space without necessarily improving understanding.
Every figure should be understandable without forcing the reader to search elsewhere for essential information. Axis labels, units, legends, sample sizes, and explanatory captions should be included where necessary. The surrounding text should identify the important pattern rather than merely saying that “Figure 1 shows the results.”
Statistical reporting should also remain connected to the research question. A p-value, confidence interval, effect estimate, model coefficient, or other statistic is not meaningful simply because it appears in a table. Readers need enough context to understand what was tested, what the estimate represents, and how it contributes to the conclusion.

Source: Tahatū Career Navigator
Tables, Graphs, Figures, and Equations
A template should make visual evidence easy to add without allowing it to dominate the report. Figures should be placed close enough to the relevant discussion that readers can connect the image to the text. At the same time, a large number of graphics can make a report difficult to navigate if every minor calculation becomes a separate figure.
Tables should have descriptive headings and clearly labeled columns. Units should be consistent, and missing values should be explained when their meaning is not obvious. Excessive decimal places can imply a level of measurement precision that the underlying instrument or method does not support.
Graphs require similar care. The type of graph should reflect the data. A line graph can communicate change over an ordered variable, while a scatter plot can show relationships between continuous measurements. Bar charts may be appropriate for discrete comparisons, but they should not be used automatically when another representation better communicates the structure of the data.
Equations need definitions. If a formula is introduced, identify the variables and explain any assumptions that matter to its interpretation. A reader should not have to infer what a symbol means from a separate spreadsheet or laboratory notebook.
When editing the document, check that every table and figure referenced in the text actually exists and that numbering remains sequential after revisions. Word processors and document editors can sometimes create broken cross-references when content is moved manually, so a final visual and technical check is worthwhile before submission.

Source: IdeoPak
Data Analysis: From Raw Measurements to Findings
Data analysis is the bridge between collected observations and reported conclusions. The report should make that bridge visible. Readers should be able to understand how raw observations became variables, how variables were summarized or modeled, and how the analysis supports the claims made later in the discussion.
Begin by identifying the structure of the dataset. Determine which observations belong to which experimental groups, which variables are predictors or outcomes, and which measurements are repeated, independent, categorical, or continuous. These decisions influence which analytical approaches are appropriate.
Cleaning should be documented rather than hidden. Missing values, impossible measurements, duplicate records, instrument errors, and predefined exclusion criteria may all require attention. The report does not need to reproduce an entire data-cleaning log, but important decisions should be explained so that the analysis can be evaluated.
Exploratory analysis can reveal distributions, outliers, trends, or unexpected relationships. Confirmatory analysis then addresses the research questions using methods appropriate to the study design. Keeping these stages conceptually distinct helps prevent an exploratory pattern from being presented as though it had been predicted before the data were examined.
The final report should focus on the analytical results that matter. A template can include a dedicated subsection for analysis, but that subsection should not become a dumping ground for every output generated by statistical software. Select evidence that helps answer the research question and place supporting material in an appendix when appropriate.

Source: Suzuyo
Discussion: Explaining What the Results Mean
The discussion is where scientific interpretation becomes explicit. It should begin with the most important findings and explain how they answer the research question. A strong discussion does not simply repeat the results; it interprets patterns, evaluates expectations, and connects the evidence to broader scientific knowledge.
Compare the findings with the expectations established in the introduction. If the results support the hypothesis, explain what aspect of the evidence supports it. If the results do not support the hypothesis, describe the discrepancy without treating an unexpected result as a failure of the research.
Unexpected findings should receive careful attention. Possible explanations can include methodological limitations, sampling differences, measurement uncertainty, uncontrolled variables, biological or physical variability, or a genuine phenomenon that deserves further study. Explanations should be presented as interpretations supported by evidence, not as facts when the study did not directly test them.
Limitations belong in the discussion because they help readers understand the boundaries of the conclusions. A limitation is not simply an apology for imperfect research. It identifies a condition that affects how confidently the findings can be generalized or interpreted.
The final part of the discussion can consider implications and future research. Useful recommendations follow logically from the findings and limitations. Avoid generic statements such as “more research is needed” unless you can specify what future work should investigate, how it could improve the evidence, and why that work would matter.

Source: BioPharmaTrend
References and Source Management
References show readers where supporting information came from and allow them to trace the evidence behind claims. The required citation style depends on the discipline, institution, or publication. APA, numbered citation systems, author-date systems, and journal-specific formats are all used in scientific communication.
A template should therefore make references easy to manage without hard-coding a style that may not apply to the project. If a university specifies APA, use APA. If a journal specifies numbered references, follow the journal. The visual appearance of the reference list is secondary to consistency and compliance with the applicable instructions.
Reference management software can reduce manual errors, especially in long reports. However, automated citation tools are not infallible. Authors should still check author names, publication years, titles, journal details, page information, identifiers, and whether every cited source actually appears in the reference list.
Source quality matters as much as formatting. Primary research articles, official datasets, recognized standards, government publications, university guidance, and authoritative technical documentation may be appropriate depending on the claim. A template cannot compensate for weak or irrelevant evidence.
When adapting a scientific report template to a new project, review every example citation and placeholder. Sample references are often left behind accidentally, and a stray example citation can create confusion about which sources actually support the research.

Source: Phys.org
Scientific Reports for Students
A scientific report template to edit for students should provide more guidance than a professional manuscript template. Students are still learning how scientific arguments are constructed, so headings can include brief prompts that explain what belongs in each section.
For an introductory laboratory report, prompts might ask for the research question, hypothesis, variables, materials, method, observations, results, sources of uncertainty, and conclusion. These prompts can be removed as the student’s skills develop, allowing later reports to resemble professional scientific writing more closely.
Students should also learn that a laboratory notebook and a formal report are not the same document. The notebook records the working process, observations, decisions, and raw information. The formal report selects and organizes relevant evidence for communication to a reader who needs to understand the investigation.
A student template should encourage quantitative language. Instead of writing that a sample became “much hotter,” the report should provide the relevant measurement, units, conditions, and comparison when those data are available. Precision makes the report more scientific and gives readers something they can evaluate.
Students should also be taught to distinguish observation from interpretation. “The solution changed from clear to cloudy” is an observation. “The reaction produced a precipitate” is an interpretation that may be justified by the evidence, but the distinction matters when deciding what the experiment actually demonstrated.

Source: Community Foundation of Howard County
Scientific Reports for Publication
A scientific report template to edit for publication must be treated as a starting framework rather than a journal-ready manuscript by default. Publication requirements can vary in section order, word limits, figure specifications, reference style, supplementary files, declarations, and formatting.
Before adapting a template for a journal submission, read the target journal’s current instructions for authors. Compare the required manuscript structure with the template and remove anything that the journal does not request. Then add mandatory sections that the template lacks.
Publication-oriented reports also require particular attention to claims. Statements should be supported by the data and appropriate literature. Authors should avoid implying that a correlation proves causation, avoid overstating generalizability, and distinguish exploratory findings from predefined hypotheses where relevant.
Figures require special care at publication stage. Resolution, file format, color requirements, font size, labeling, and placement can all be controlled by journal instructions. A report that looks excellent on a laptop screen may still require substantial figure preparation before submission.
Finally, publication is not simply a formatting exercise. A polished template cannot turn incomplete methods, inconsistent data, unsupported conclusions, or unclear scientific reasoning into a publishable manuscript. The template becomes valuable when it supports an already rigorous research process.

Source: Columbia Stem Cell Initiative
Choosing Word, PDF, Google Docs, or Spreadsheet Workflows
The best file format depends on what you need to do. Word-processing software is generally well suited to long narrative reports because it supports headings, references, tables, figures, comments, tracked revisions, and page layout. A scientific report word template is particularly practical when the report will be submitted as an editable document or converted to another format later.
PDF is usually best understood as a distribution or submission format rather than the primary environment for drafting. A scientific report template to edit pdf can be useful when a form contains fillable fields, but ordinary PDF files are less convenient for substantial scientific revision than editable source documents.
A scientific report template to edit google docs can be useful when multiple people need to comment on the same document, particularly during early drafting. Collaborative editing can simplify supervisor feedback and reduce the number of conflicting document versions.
Spreadsheet software has a different role. A scientific report template to edit in excel may be appropriate for structured data collection, calculations, summary tables, or repeatable analysis workflows. It is generally less suitable as the sole environment for a long narrative manuscript, but it can complement the main report extremely well.
The most reliable workflow is often hybrid: collect and validate data in a structured data file, analyze the data using appropriate tools, draft the narrative in a word processor or collaborative document editor, and export a stable PDF when a final submission or review copy is required.

Source: TypeCalendar
What Makes a Template Truly Editable?
Editing should go beyond typing over placeholder text. A genuinely useful template lets you modify headings, reorder sections, resize tables, insert figures, update references, change author information, and remove irrelevant fields without causing the entire document to become unstable.
Use consistent heading levels. Main sections should use one heading level, subsections another, and deeper subdivisions should follow a predictable hierarchy. This makes the document easier to navigate and allows automatic tables of contents or navigation panes to work correctly.
Use styles instead of manually changing individual headings wherever possible. If every section title is formatted independently, a later design change becomes tedious. Styles allow the writer to make systematic changes without manually editing every occurrence.
Tables should also be designed for editing. Avoid excessive merged cells, unnecessary decorative borders, or layouts that break when text wraps. A table should remain readable after longer titles, additional rows, or different measurement units are inserted.
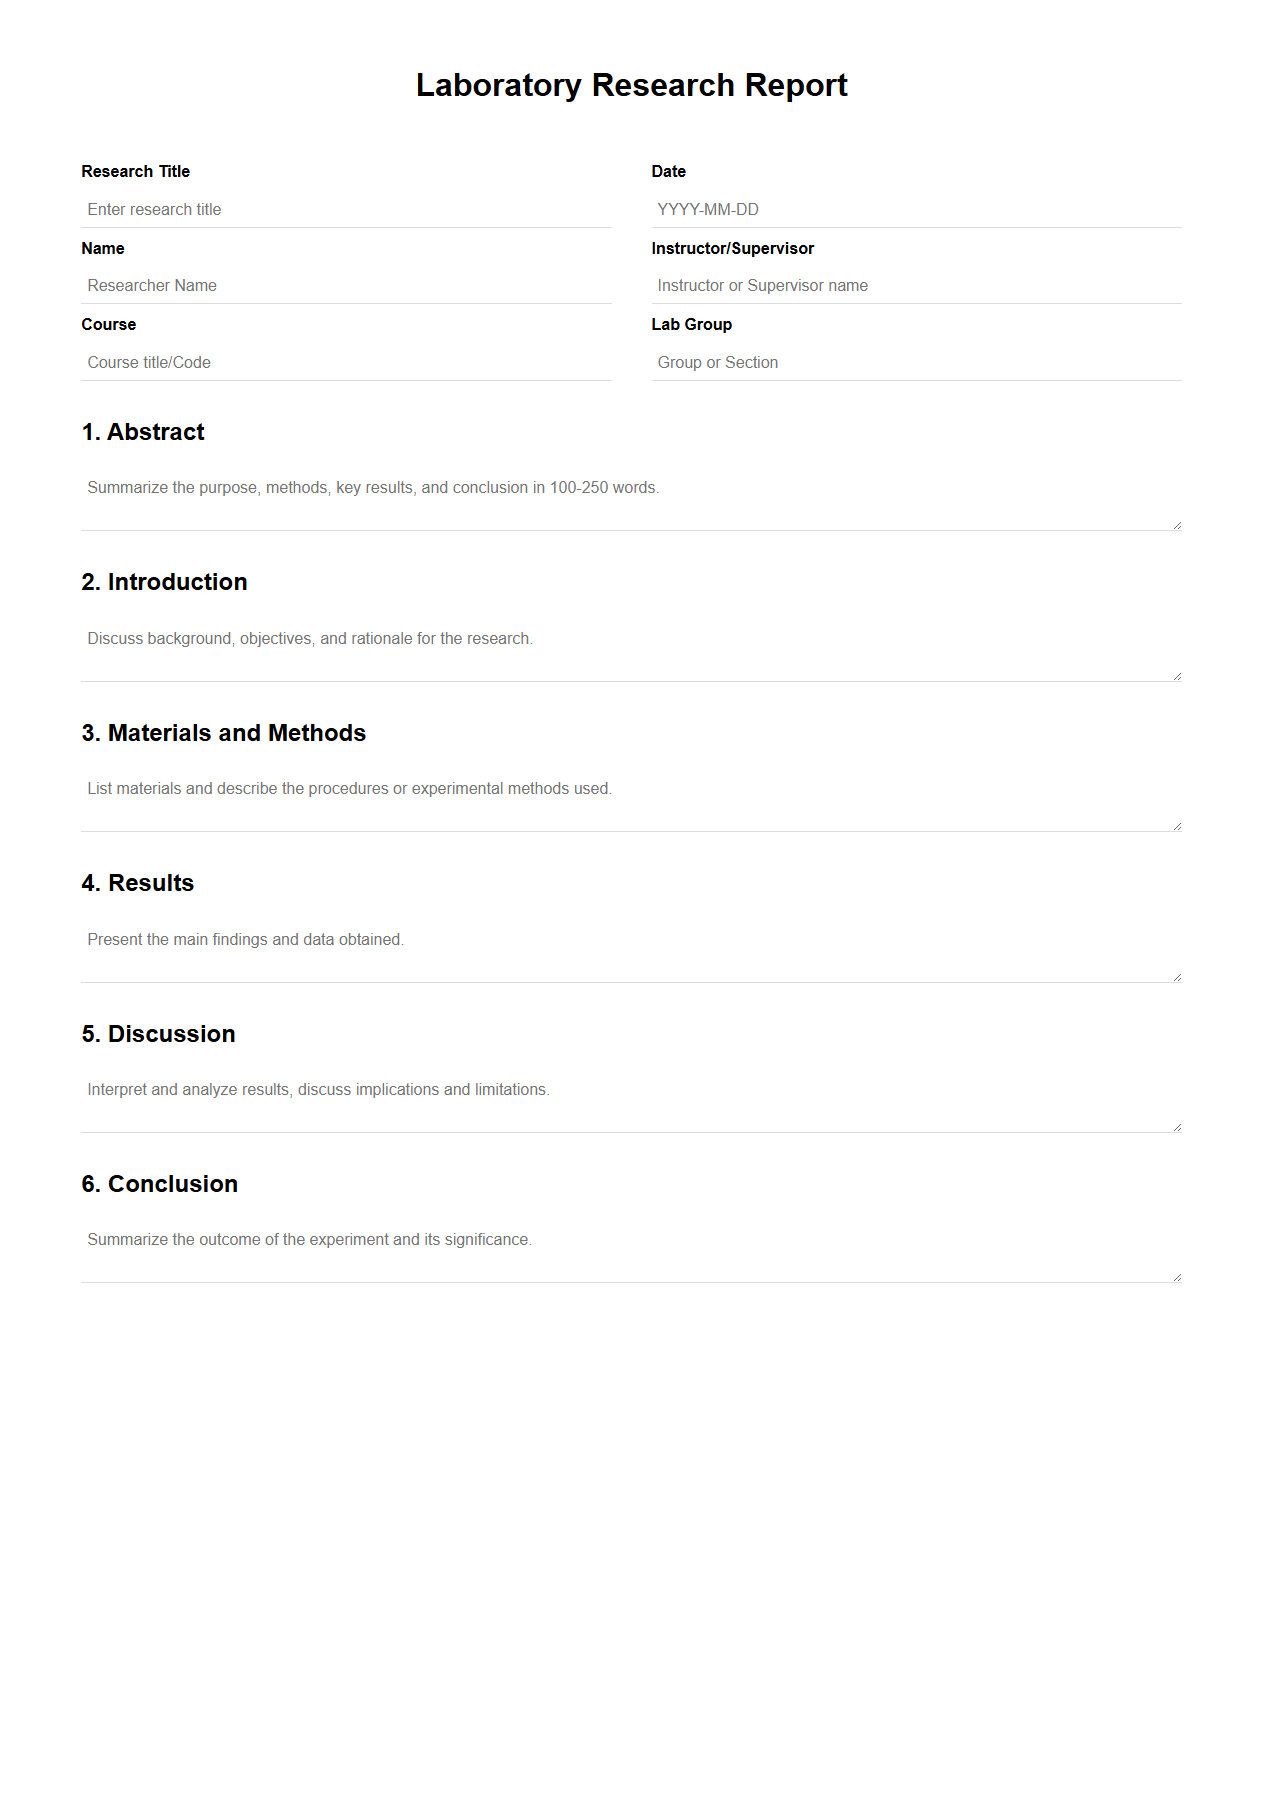
Placeholder instructions should be visually distinct during drafting but removed before submission. A report should never contain text such as “insert result here,” “add citation,” or “write two paragraphs” in the final version unless the document is intentionally being used as a worksheet.
Source: Documentof
Scientific Report Template to Edit in Word: Best Practices
When using a Word-based template, create the document structure before entering large amounts of content. Establish the page size, margins, heading hierarchy, paragraph spacing, figure treatment, table style, and reference approach first. This reduces the amount of formatting work required later.
Use automatic page numbering rather than manually typed numbers. Use automatic heading styles rather than bold text that only looks like a heading. Where appropriate, use automatic captions and cross-references for figures and tables so numbering can update when content moves.
Keep figures at a readable size. A graph that is technically present but too small to interpret does not satisfy the communication purpose of the report. If a figure contains several panels, make sure each panel has clear labels and that the text explains what the panels represent.
Track substantive revisions separately from cosmetic revisions. Changing a heading font is a formatting change; changing a sentence from “caused” to “was associated with” is a scientific change. The latter deserves more careful review because it changes the strength of the claim.
Before exporting the final version, inspect the entire document from beginning to end. Check headings, page breaks, figure placement, tables, references, equations, special characters, hyperlinks, and appendices. Then open the exported PDF independently to confirm that nothing changed during conversion.

Source: International Union of Crystallography
Scientific Report Template to Edit Free: What to Look For
When searching for a scientific report template to edit free, focus first on structure and usability rather than visual appearance. A free template can be excellent if its section hierarchy is logical, its placeholders are clear, and its format is easy to modify.
Free resources vary significantly in quality. Some are designed for elementary or secondary education, some for university laboratories, and others for professional reporting. The fact that a template is free does not mean it is appropriate for every research context.
Check whether the template separates the methods, results, and discussion. A form that combines all three into one large “findings” section may be adequate for a short classroom activity but unsuitable for a detailed research report.
Also check whether the template leaves room for the actual evidence. A visually attractive cover page is of little value if there is insufficient space for methods, statistical analysis, figures, limitations, and references. Scientific usefulness should always take priority over decorative design.
A scientific report template to edit free download can be particularly convenient when you need an offline starting point. Before relying on any download, confirm what file format it contains, whether the resource is genuinely free, and whether any licensing or account requirements apply.

Source: Poster-M
Common Mistakes When Editing Scientific Templates
One common mistake is preserving sections that do not apply. A writer may leave an empty “Hypothesis” heading in an observational study simply because it exists in the template. Empty or irrelevant sections make the report look unfinished and can confuse readers about the research design.
Another mistake is treating the template’s example text as a model that must be copied. Placeholder wording is often generic. It may demonstrate formatting rather than provide scientifically appropriate language for the new study.
Over-formatting is another problem. Multiple fonts, decorative colors, oversized headings, unnecessary boxes, and excessive visual effects can make a scientific report resemble a marketing document. Scientific communication usually benefits from restraint and consistency.
Writers also sometimes confuse a clean layout with a correct report. A beautifully formatted document can still contain weak methods, unsupported claims, missing controls, inappropriate statistics, or incomplete references. Content quality must be checked independently of formatting.
Finally, do not assume that a template’s structure is an official requirement. Universities, laboratories, funding bodies, and journals can have their own rules. A template may represent common practice, an educational example, or a particular author’s preference rather than a mandatory standard.
Source: Lumoral
How to Improve Scientific Writing Inside the Template
Good scientific writing is precise without becoming unnecessarily complicated. Replace vague statements with measurable descriptions when the data permit. “The treatment improved performance” is weaker than a statement that identifies the measured outcome, comparison, and relevant uncertainty.
Keep sentences focused. A paragraph should normally develop one connected idea rather than combine unrelated methodological details, results, and interpretations. Clear paragraph structure is especially important in the introduction and discussion, where the report is building an argument rather than simply listing observations.
Use terminology consistently. If a variable is called “reaction time” in the methods, do not later call it “response duration” unless the terms genuinely mean different things. Consistent terminology reduces ambiguity and helps readers connect methods, tables, figures, and conclusions.
Be careful with causal language. Words such as “caused,” “produced,” “prevented,” and “demonstrated” can make strong claims. The appropriate wording depends on study design and evidence. Observational research, for example, generally requires more caution about causal conclusions than a well-controlled experiment.
Finally, revise for the reader rather than only correcting grammar. Ask whether a reader who understands the field but did not conduct the study could follow the logic from question to method to evidence to conclusion. That is a more meaningful test than simply checking for spelling errors.

Source: Toronto Metropolitan University
Practical Example: Turning an Experiment Into a Report
Consider a hypothetical experiment investigating whether three light levels affect the growth of seedlings. The raw research process might produce measurements of plant height, leaf count, light intensity, watering schedules, soil conditions, and observations about plant health.
The template would first capture the research question and hypothesis. The introduction could explain why light availability matters to plant growth and identify the specific relationship being tested. The methods would describe the seedlings, containers, light treatments, duration, measurement schedule, environmental controls, and procedure.
The results could present mean plant height by treatment, a graph showing change over time, and a table containing relevant measurements. If appropriate, statistical analysis could compare the groups or model growth over time. The results section would describe the observed pattern without prematurely explaining why it occurred.
The discussion could then interpret whether the findings support the hypothesis, compare the pattern with relevant scientific literature, consider possible confounding factors, and identify limitations. For example, unequal watering, small sample size, or differences in starting plant size could influence the interpretation.
The conclusion would answer the research question directly and conservatively. The purpose of the template is to make this chain visible so that a reader can move from the original question through the evidence to the final conclusion without having to reconstruct the researcher’s reasoning.
Source: La Vérité
Practical Solution: A Reliable Workflow for Using a Scientific Report Template to Edit
Start by identifying the purpose of the report before opening the template. Determine whether it is a classroom laboratory report, university research report, internal technical report, thesis chapter, conference submission, or journal manuscript. This decision determines which sections are necessary and how formal the document needs to be.
Next, compare the template with the applicable requirements. Check the assignment brief, departmental guidance, laboratory instructions, or journal author guidelines. Remove irrelevant sections and add required ones before drafting. This is much easier than restructuring a nearly finished report.
Then organize the evidence. Gather the research question, raw data, processed data, analysis outputs, laboratory notes, references, figures, tables, and methodological records. Keep raw and processed information distinguishable, and make sure important calculations can be traced back to their source data.
Draft the methods while the research details are still fresh. Then build the results around the research question. Create only the tables and figures that communicate meaningful evidence. Write the discussion after the results are stable enough to interpret, and write or finalize the abstract after the complete report has been reviewed.
Finish with a technical audit. Check that every claim is supported, every figure and table is referenced, every citation appears in the reference list, units are consistent, statistical terminology is accurate, headings are correctly nested, and all placeholder text has been removed. Then produce the required submission format and inspect that final file rather than assuming the export is perfect.
Source: TypeCalendar
Reference Examples
The following examples illustrate different visual approaches to editable scientific and laboratory reporting. They are useful for comparing structure, document presentation, student-oriented layouts, publication-style pages, and data-oriented reporting workflows. A visual example should be treated as inspiration rather than as a universal formatting requirement.
scientific report template to edit

Source: Teachers Pay Teachers
scientific report template to edit in word

Source: OriginLab
scientific report template to edit pdf

Source: Same Day Rush Printing
scientific report template to edit google docs
Source: Yomu
scientific report template to edit for students
Source: Toronto Metropolitan University
scientific report template to edit for publication
Source: International Union of Crystallography
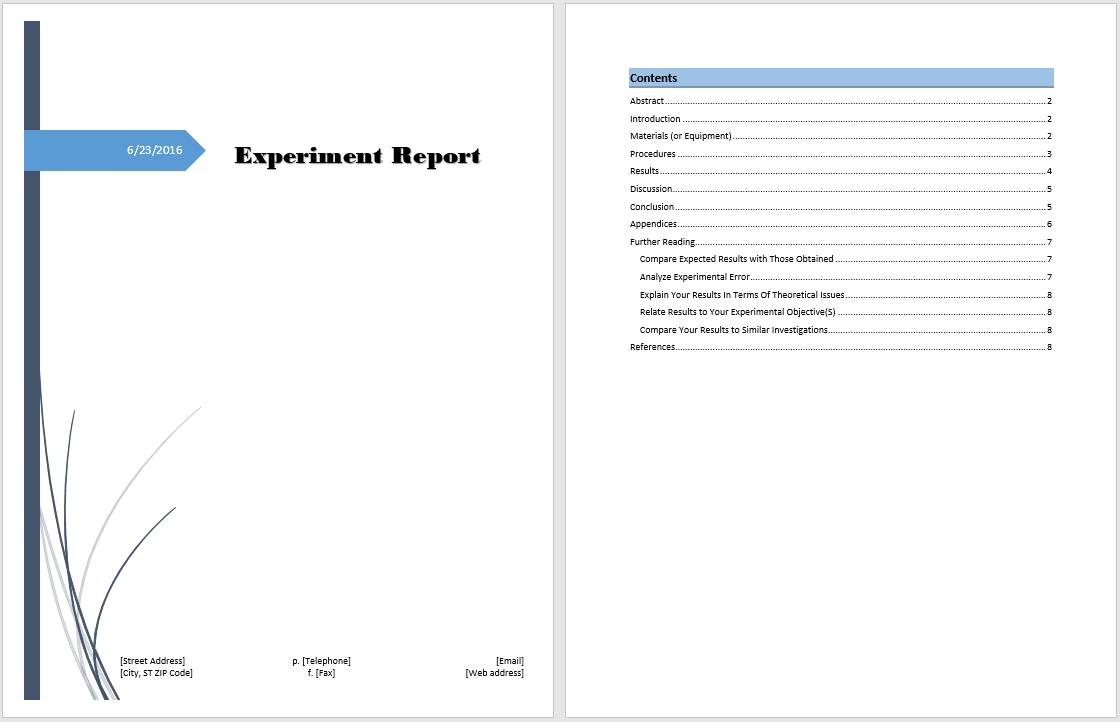
scientific report template to edit free download
Source: My Word Templates
scientific report template to edit in excel

Source: Gazillions
Frequently Asked Questions
What should a scientific report template contain?
A useful template normally contains a title area and sections appropriate to the research design, commonly including an abstract, introduction, methods, results, discussion, references, and sometimes a conclusion or appendices. The exact structure should be adjusted to the discipline and the instructions supplied by the institution or publication venue.
Can I use the same template for every scientific project?
You can reuse the underlying framework, but you should not assume that every project needs identical sections. An experiment, field study, survey, qualitative project, computational investigation, and journal manuscript can require different subsections. Reuse the structure where it helps and remove anything that does not serve the study.
Is a Word template better than a PDF template?
For drafting and substantial editing, an editable word-processing document is generally more flexible. PDF is more useful as a stable presentation or submission format, although fillable PDF forms can be useful for structured data entry. A practical workflow often uses an editable source document and produces PDF only after the report is finalized.
Can a scientific report be written in Google Docs?
Yes. A collaborative document editor can be useful when several people need to draft, comment, or review the same report. The important issue is not the software brand but whether the document supports the required structure, formatting, references, tables, figures, and final submission requirements.
Should the results and discussion be separate?
Often, yes, particularly in empirical scientific reports using IMRaD. Results generally report the evidence, while discussion interprets its meaning and connects it to previous knowledge. Some disciplines or report types combine them, so the applicable academic or publication requirements should take priority.
How long should a scientific report be?
There is no universal length. A short student laboratory report may occupy only a few pages, while a thesis, technical report, or research manuscript can be much longer. The correct length is the amount needed to explain the research clearly without omitting essential evidence or adding irrelevant material.
Should every result have a graph?
No. A graph is useful when it reveals a pattern, relationship, distribution, or comparison more effectively than prose or a table. Some results are better reported as concise text or a table. The objective is clear communication, not maximizing the number of figures.
Can I use a free template for a professional research report?
You can use a free template as a starting point, provided its structure is appropriate and its licensing terms permit the intended use. For professional or publication work, the template should be adapted to the organization’s or journal’s current requirements before submission.
What is the biggest mistake when using a report template?
The biggest mistake is treating the template as the authority rather than as a framework. The research question, evidence, methods, analysis, and applicable reporting requirements should determine the final structure. A template is useful because it saves organizational effort, not because every field or heading must remain unchanged.
Conclusion
A well-designed scientific report template to edit is more than a formatted document. It is a practical framework for turning research activity into clear scientific communication. The most useful templates make the research question, methodology, evidence, analysis, interpretation, limitations, and conclusions easy to identify while remaining flexible enough for different disciplines and study designs. Whether you work in Word, PDF, Google Docs, Excel, or another environment, the best workflow is to adapt the template to the actual research, verify every requirement before submission, and treat formatting as support for rigorous scientific reasoning rather than a substitute for it.
