The most useful template is therefore not necessarily the most elaborate one. A student completing a two-page chemistry experiment needs a different level of detail from a research team documenting a multi-stage project. The underlying principle is consistency: every important piece of evidence should have an obvious place, and every section should have a clear purpose.
This guide explains how to build and use a scientific report from the ground up. It covers report architecture, research planning, data collection, analysis, figures and tables, writing style, document formats, student workflows, digital templates, common mistakes, and a practical solution for producing a reliable report efficiently.
It also addresses several format-specific searches and template names that can be confusing. Some phrases refer to genuine document formats, while others describe platforms, government forms, or adjacent reporting tools rather than scientific reporting itself. Understanding that distinction prevents a template from being selected merely because its title sounds relevant.
What Is a Scientific Report Template?
A scientific report template is a pre-structured document designed to guide the presentation of an investigation or research project. It normally establishes headings, subheadings, page structure, placeholders for tables and figures, reference areas, and sometimes formatting conventions for equations, captions, appendices, and supplementary material.
The template does not replace scientific judgment. It tells you where information belongs, but it cannot determine whether a hypothesis is reasonable, whether measurements are reliable, whether an analysis is appropriate, or whether a conclusion is justified by the evidence. Those remain responsibilities of the researcher or student.
In experimental science, the familiar IMRaD structure—Introduction, Methods, Results, and Discussion—is particularly common. Longer reports may add a title page, abstract, literature review, theoretical background, conclusion, references, and appendices. Some laboratory courses combine discussion and conclusion, while others require them separately. :contentReference[oaicite:1]{index=1}
A good template also creates consistency across multiple reports. If every experiment records the objective, variables, method, raw observations, processed results, uncertainty, interpretation, and references in predictable locations, later comparison becomes easier. This is especially valuable for research groups, recurring laboratory classes, quality programs, and longitudinal projects.
The best way to think about a template is as a communication framework. It should help a reader answer five questions quickly: What was investigated? Why was it investigated? How was it investigated? What was found? What do those findings mean?
Why Structure Matters
Scientific writing is structured because readers need to separate evidence from interpretation. A clearly labeled Methods section, for example, lets a reader distinguish what the researchers actually did from what they later inferred from the results.
Structure also supports reproducibility. A useful method description provides enough relevant information for another researcher to understand the materials, participants or samples, apparatus, procedures, data collection, and analysis. A template can prompt the writer to record these details instead of discovering at the end that important information is missing. :contentReference[oaicite:2]{index=2}
Good structure improves editing as well. When the report has stable headings and consistent formatting, reviewers can comment on individual sections without repeatedly explaining where information should have been placed.
For students, structure has an additional learning benefit. Writing a report forces the writer to connect practical activity with scientific concepts, evidence, analysis, and conclusions. University academic-skills guidance frequently emphasizes that laboratory reports develop both scientific communication and analytical skills. :contentReference[oaicite:3]{index=3}
For professional researchers, structure becomes a form of documentation control. A report may eventually be reviewed by collaborators, supervisors, auditors, clients, regulators, editors, or future researchers. Consistency makes that review substantially easier.
Core Sections of a Scientific Report
Although requirements differ, most scientific reports can be built from a common set of components. The following structure works as a flexible starting point rather than an absolute rule.
1. Title Page or Report Header
The title should identify the investigation precisely. Avoid vague titles such as “Science Experiment” or “Lab Report.” A useful title normally indicates the subject, system, relationship, material, population, or variable being studied.
A student report may also include the student’s name, course, instructor, experiment number, laboratory partner, institution, and submission date. A professional report may instead use a project identifier, client, authoring organization, version number, reporting period, and approval information.
The title page should be visually simple. Decorative elements should never compete with the report’s identification information, particularly when the document will be printed, archived, or converted to PDF.
For longer reports, the opening pages may also contain an abstract, table of contents, list of figures, list of tables, abbreviations, or document-control information. Not every report needs all of these elements.
A useful template separates fixed metadata from editable content. For example, the report number and project name can have dedicated fields, while the scientific title remains a normal heading that can be changed for each investigation.
2. Abstract
The abstract is a compact representation of the whole study. It should normally communicate the purpose or research question, the broad method, the principal result, and the significance or conclusion.
It should not become a miniature introduction that spends most of its space explaining background theory. Readers should be able to understand what was done and what was discovered without reading several paragraphs of context first.
For an experimental report, a strong abstract might state that a relationship between two variables was tested, describe the broad experimental approach, summarize the observed pattern, and state whether the evidence supported the hypothesis.
Numbers can be useful when they represent an important finding, but the abstract should not become a table of measurements. Select only results that materially help the reader understand the outcome.
Write the abstract after the main report is complete unless an instructor specifically requests otherwise. At that point, the writer knows which findings are genuinely important and can summarize them accurately.
3. Introduction and Background
The introduction establishes the scientific context. It should explain the topic, identify the relevant theory or previous knowledge, describe why the investigation matters, and lead logically toward the research question, aim, or hypothesis.
Good introductions move from broad context toward the specific problem. They do not attempt to include everything known about the subject. Background information belongs in the report only when it helps the reader understand the investigation.
Definitions should be included when terminology could reasonably be misunderstood. Acronyms should be introduced before being used repeatedly. Equations should be explained rather than inserted without context.
The final part of the introduction should make the study’s purpose unmistakable. A reader should understand what the investigation is intended to determine before reaching the Methods section.
In a research project, the introduction may include a focused literature review. In a short laboratory exercise, it may consist of only a few paragraphs explaining the relevant scientific principle and the experiment’s objective.
4. Research Question and Hypothesis
A research question defines what the investigation is trying to discover. A hypothesis proposes an expected relationship or outcome that can be tested against evidence.
A useful hypothesis is specific enough to be evaluated. Instead of writing “temperature affects the reaction,” a stronger example would predict the direction of the effect and identify the relevant conditions.
The hypothesis should follow from the background information rather than appearing as an unsupported guess. This connection makes the Discussion section easier because the writer can later compare observed evidence with the prediction.
Not every scientific investigation requires a formal hypothesis. Descriptive studies, exploratory research, qualitative investigations, and some observational projects may instead use research questions or objectives.
A template should therefore allow the user to rename or omit this section when appropriate. Rigid templates often create poor reports because they force a research design into an unsuitable structure.
Methods, Materials, and Experimental Design
The Methods section explains how the research was conducted. Its central purpose is transparency: the reader should understand the design, data sources, procedures, and analytical methods well enough to evaluate the evidence and, where appropriate, reproduce the work.
A method section should distinguish between materials and procedure. Materials describe what was used; procedure describes what was done. In larger studies, separate subsections may cover participants, samples, equipment, experimental design, data collection, data processing, and statistical analysis.
Write the method precisely rather than rhetorically. “The sample was carefully prepared” is less informative than describing the actual preparation conditions, quantities, sequence, timing, or relevant controls.
Details should be included when they could influence the result. A report does not need to document every trivial action, but it should not omit variables that materially affect interpretation.
The method is also where the report can demonstrate experimental discipline. Controls, calibration procedures, randomization, replication, inclusion criteria, exclusion criteria, and quality checks should be described when they are part of the research design.
A well-designed scientific report template can include prompts for sample identification, equipment, units, environmental conditions, procedural steps, deviations, and analysis software. These prompts reduce the chance that important details disappear between the experiment and the writing stage.
Methods are often easiest to write while the experimental process is still fresh. Keeping contemporaneous notes makes the final report more accurate than relying on memory several days or weeks later.
When a procedure changes during an investigation, record the actual procedure rather than silently copying the planned method. A difference between planned and performed methods can be scientifically important.
The method should also distinguish planned conditions from observed events. For example, if an experiment was intended to run for 30 minutes but was interrupted after 24 minutes, that fact belongs in the record and may later belong in the limitations discussion.
In professional environments, version control becomes particularly important. A report should make it possible to determine which protocol, instrument configuration, dataset, or analytical method was used.
The goal is not maximum length. The goal is sufficient information for a scientifically competent reader to understand what happened and why the resulting evidence should be interpreted in a particular way.
Methods also benefit from consistent units. If measurements are recorded in milliliters, grams, seconds, degrees Celsius, or another unit, the unit convention should be stable throughout the report unless a conversion is explicitly explained.
Scientific notation, significant figures, and decimal precision should reflect the measurement process. A template can help standardize presentation, but it cannot decide appropriate precision without understanding the instrument and analytical method.
For research involving human participants, animal subjects, sensitive data, or potentially hazardous materials, the report may need additional information about approvals, consent, safety, ethics, or handling procedures. Requirements are discipline- and institution-specific and should be checked against the applicable rules.
Methods should avoid unsupported claims about quality. Instead of saying an experiment was “perfectly controlled,” document the controls that were actually used.
Finally, distinguish the method from the results. The method says how a measurement was obtained. The result says what measurement was obtained. Keeping those functions separate makes the report easier to follow.
Data Collection and Research Notes
Data collection is where the report’s eventual credibility begins. Raw observations should be recorded in a way that preserves their original meaning, units, timing, sample identity, and relevant conditions.
A research notebook, electronic log, instrument export, questionnaire, field sheet, or laboratory information system can serve as the primary record. The final report should be based on those records rather than reconstructed from memory.
Raw data and processed data should be distinguishable. Raw measurements are observations as originally captured; processed data may include averages, transformations, calculated concentrations, normalized values, or statistical summaries.
Good data management also preserves unusual observations. A measurement that looks inconvenient may be scientifically meaningful. It should not be deleted merely because it makes a graph less attractive.
If a value is excluded from analysis, the reason should be documented according to the study design. “It looked wrong” is not a sufficient scientific criterion.

Designing a Useful Data Table
A data table should make the relationship between variables obvious. Put related measurements in the same row or column structure and use clear labels for every quantity.
Table headings should include units where appropriate. For example, “Temperature (°C)” is more informative than simply “Temperature.” This reduces ambiguity and prevents readers from searching elsewhere in the document for measurement conventions.
Tables are particularly useful when exact values matter. A graph is better when the main purpose is to reveal a trend, distribution, comparison, or relationship.
Do not reproduce the same information unnecessarily in three forms. If a table and graph communicate exactly the same point, decide whether both are necessary. A table can provide precise values while a graph provides the visual relationship; when both serve different purposes, using both may be justified.
Large raw-data tables can be moved to an appendix when they are essential for transparency but would interrupt the main argument. The main Results section can then present the most relevant summaries.
Results: Presenting Evidence Clearly
The Results section reports what the analysis produced. It should be factual and organized around the research questions or variables rather than around the order in which the researcher happened to perform calculations.
Results writing should identify important patterns without prematurely explaining why they occurred. Interpretation generally belongs in the Discussion, although brief statements about what a figure shows are appropriate.
Every figure and table should have a meaningful title or caption. Readers should be able to understand the subject of a visual without guessing what the axes, groups, units, or symbols mean.
Axes require labels and units when relevant. Legends should explain categories. Error bars should be defined when used, because an error bar can represent different quantities depending on the analysis.
Statistical results should be reported using the conventions appropriate to the field. The report should make clear what analysis was performed and what conclusion the statistical evidence supports.
Do not report a calculated value without explaining its role. A mean, percentage, correlation, confidence interval, test statistic, or regression coefficient is meaningful only in the context of the question being investigated.
Figures should be numbered consistently. A template can automate figure numbering, but the writer must still check that references in the text point to the correct figure.
The Results section should also distinguish statistical significance from practical or scientific significance. A small effect can be statistically detectable without being important for the real-world question.
If the results do not support the hypothesis, report that honestly. A scientific report is not a success story that must end with the prediction being confirmed.
Unexpected results can be valuable because they may reveal measurement problems, limitations in the model, an overlooked variable, or an interesting phenomenon worth further study.
When results conflict with previous research, the discrepancy should not automatically be treated as an error. Differences in samples, methods, conditions, measurement systems, or definitions can produce different outcomes.
Results should be presented in an order that supports the argument. Start with the evidence most directly connected to the research question, then move toward secondary observations or supplementary analyses.
Good formatting should make evidence easier to inspect rather than make the report look decorative. A clean figure with readable labels is more valuable than a visually elaborate chart that obscures the data.
Color should also be used deliberately. Scientific documents may be printed in grayscale, viewed by people with color-vision differences, or reproduced in formats where color contrast changes.
Figures should be large enough to read but not so large that they overwhelm the text. Templates can define sensible default widths, while the writer adjusts them when the scientific content requires more space.
A report should never rely on an image alone to communicate a critical result. The surrounding text should state the key observation in words so that the argument remains understandable even if a figure is viewed separately.
When possible, preserve access to the underlying data used to generate important charts. This supports later verification and makes revisions much easier.

Choosing Between Tables and Graphs
Tables are best when the reader needs exact values, detailed comparisons, or a compact record of multiple measurements.
Line graphs are usually appropriate for trends over an ordered variable such as time. Bar charts can work well for comparisons among discrete categories, while scatter plots are useful for examining relationships between two quantitative variables.
Pie charts are often less effective for precise scientific comparison because estimating angles or areas is harder than comparing aligned values. The best visualization depends on the analytical question, not on visual fashion.
A graph should not imply a relationship that the research design cannot support. Correlation, for example, does not by itself establish causation.
When a chart contains uncertainty, show it in a way that communicates what is known and what is not. A visually precise line should never create an impression of certainty that the measurements do not support.
Discussion: Turning Results Into Scientific Meaning
The Discussion is where the report moves from “what happened” to “what the findings mean.” It should connect the results to the research question, hypothesis, theory, prior research, and limitations.
A useful Discussion begins with the principal finding. The writer should then explain whether it supports the expected relationship and identify plausible reasons for the observed pattern.
Interpretation should be grounded in evidence. If a reaction slowed as temperature decreased, the Discussion can connect that observation to relevant scientific theory rather than simply saying that “temperature caused the change.”
Alternative explanations should be considered where appropriate. A single result may be consistent with more than one mechanism, especially when the experiment has limited controls.
Limitations should be specific. Instead of writing “there were some errors,” identify the source, direction or likely impact, and whether the limitation could be addressed in a future experiment.
Potential sources of error may include instrument resolution, sampling variation, environmental changes, procedural inconsistency, uncontrolled variables, measurement timing, contamination, selection bias, or model assumptions.
A limitation does not automatically invalidate a study. Good scientific discussion explains what the limitation means for the strength and scope of the conclusion.
Future work should follow logically from the evidence. A useful recommendation might be to increase replication, change the measurement range, introduce a control, test an alternative mechanism, or repeat the experiment under another condition.
Discussion sections should avoid introducing completely new data that were never described in the Results. If a new analysis is important, it generally belongs in the Results as well.
The Discussion can also explain surprising observations. A surprising result can become one of the most informative parts of the report when the explanation is careful and evidence-based.

Conclusion and Recommendations
The conclusion should answer the original research question directly. It should not simply repeat the abstract or restate every result.
A strong conclusion identifies the central finding, indicates what the evidence means, and explains the extent to which the objective was achieved.
If a hypothesis was tested, the conclusion can state whether the findings support, partially support, or fail to support it. Avoid language that implies certainty beyond the evidence.
Recommendations should be included when they have a practical purpose. In a student laboratory, that may mean suggesting a better control or improved measurement. In professional research, recommendations may influence further testing, implementation, monitoring, or decision-making.
The final paragraph of the main report should leave the reader with a clear understanding of what the investigation established and what remains uncertain.
How to Build a Scientific Report Template
Start by identifying the report’s audience and purpose. A template for a first-year laboratory class should be simpler than a template for a multidisciplinary research group.
Next, list the information that must appear in every report. This usually includes the title, purpose, background, method, results, discussion, conclusion, and references, with additional fields based on the research design.
Then define a hierarchy. Heading 1 can represent major sections, Heading 2 can represent subsections, and Heading 3 can represent detailed topics. Using styles rather than manual formatting makes later editing much easier.
Set the page size, margins, body font, heading styles, paragraph spacing, table style, caption style, and page-number system once. The user should then be able to focus on content instead of formatting every paragraph individually.
Finally, test the template by creating a complete sample report. A template that looks good when empty may fail when a long table, equation, figure, appendix, or unusually long heading is inserted.

Use Styles Instead of Manual Formatting
Styles are one of the most important features in a reusable report template. They allow the document to maintain consistent typography while supporting automated navigation and table-of-contents generation.
A heading should be a real heading, not merely bold text that looks like one. Proper structural styles allow software to understand the document hierarchy.
Figure captions should also use a consistent caption style. This helps with numbering and makes it easier to generate lists of figures in longer reports.
Tables should have consistent header formatting and spacing. Avoid manually adjusting every cell unless the scientific content genuinely requires a custom layout.
References should use a citation system appropriate to the discipline. A template should not impose APA, IEEE, Vancouver, Harvard, or another style when the assignment or publication requires something different.
Scientific Report Template Word and DOCX Workflows
A Word-based workflow is useful when the report contains substantial prose, tables, figures, equations, tracked revisions, or institutional formatting requirements. Microsoft currently provides report and academic-paper templates through Word for the web, including formats intended for lab reports and student reports. :contentReference[oaicite:4]{index=4}
When searching for a scientific report template word, check whether the resource is genuinely a scientific or laboratory report rather than a generic business report that happens to contain the word “scientific.” The headings and intended use matter more than the title.
A scientific report template word free download can be useful when its licensing and distribution terms are clear. “Free” can mean free to view, free to edit, free for personal use, or free for commercial use, so those meanings should not be assumed to be interchangeable.
A Word template is particularly useful when the final document will be distributed as DOCX and later converted to PDF. Styles, headings, captions, cross-references, page breaks, and tables should be tested after conversion because layout can change.
Microsoft’s own guidance also shows that Word templates can be used for academic papers, lab reports, and other structured reports, with the template providing the framework while the writer replaces placeholder content. :contentReference[oaicite:5]{index=5}

When Word Is the Right Choice
Word is often the easiest choice for students who already receive assignments in DOCX, especially when instructors use comments and tracked changes.
It is also practical for teams that need collaborative editing but do not require a fully reproducible code-based document pipeline.
Word handles mixed content well: narrative text, tables, images, equations, appendices, signatures, and administrative fields can all coexist in one document.
Its weakness is that complex scientific documents can become fragile if users manually override styles, insert excessive spaces, or position figures with uncontrolled text wrapping.
The best Word template is therefore intentionally restrained. It should automate recurring structure while leaving enough flexibility for the scientific content.
Scientific Report Template Google Docs
A scientific report template google docs workflow is attractive when multiple contributors need to work on the same document from different locations. Google Docs supports browser-based editing and collaboration, making it convenient for student teams and distributed research groups.
Google Docs templates should still use genuine heading styles rather than manually formatted text. This keeps the report navigable and makes long documents easier to maintain.
For a short laboratory report, a Google Docs template can include fields for experiment number, title, authors, date, abstract, introduction, materials and methods, results, conclusion, and references.
One current example of a free science laboratory template describes support for both Google Docs and Microsoft Word and includes common experimental sections such as aim, hypothesis, materials, and procedure. :contentReference[oaicite:6]{index=6}
Before using any third-party template, verify whether attribution is required, whether the resource is genuinely free, and whether the file can be modified and redistributed under the intended circumstances.

Scientific Report Template for Students
A scientific report template for students should teach structure rather than hide it. Students should understand why each section exists and what kind of information belongs there.
A beginner-friendly template can provide prompts such as “What question did you investigate?”, “What was your hypothesis?”, “What materials were used?”, “What variables were controlled?”, “What did the data show?”, and “What limitations affected the result?”
As students become more advanced, the prompts can gradually disappear. A university research report should not read like a worksheet.
Student templates are especially useful when they make the difference between observations and explanations explicit. Recording “the solution became cloudy” is an observation; explaining why it became cloudy is interpretation.
Templates should also encourage complete sentences and precise scientific language. A structured page should not become a substitute for thoughtful writing.

Common Student Reporting Errors
One common mistake is writing the conclusion before analyzing the data. This can encourage students to select evidence that supports an expected answer instead of evaluating the complete dataset.
Another mistake is describing every procedural action in excessive detail while giving too little attention to the scientific reason for the experiment.
Students may also confuse precision with accuracy. A measurement can be recorded with many decimal places without actually being accurate to that level.
Another frequent issue is treating unexpected results as failures. Unexpected results are legitimate findings and can often lead to a stronger discussion.
Finally, students sometimes use a template without checking assignment instructions. The course-specific requirements always take priority over a generic template.
Scientific Report Template PDF
A scientific report template pdf is useful when the priority is consistent viewing or printing rather than ongoing editing. PDF is generally best treated as a distribution format unless the resource explicitly provides an editable source file.
PDF versions are particularly useful for submission, archiving, printing, or sharing a finalized report. They help preserve page layout across different devices.
A PDF template that is intended to be printed may contain blank fields and writing areas. A digital PDF may instead use form fields, although those fields are not necessarily supported in every viewer.
Do not assume that a PDF is editable simply because text can be selected. A PDF may contain fixed page content without providing an underlying document structure suitable for editing.
If the report will undergo repeated revisions, keep an editable master copy and generate the PDF only for appropriate distribution stages.

Scientific Report Template Excel
A scientific report template excel workflow is useful when the primary challenge is structured data rather than long-form narrative. Excel can be excellent for raw measurements, calculations, summary tables, formulas, and charts.
It is usually less suitable as the sole environment for a long scientific narrative. A better workflow is often to use a spreadsheet for data processing and a document editor for the final report.
Spreadsheet templates should separate raw data from calculations. Protecting or clearly labeling raw-data cells can reduce accidental overwriting.
Formulas should be transparent. A reader or reviewer should be able to determine how a calculated value was produced without guessing which cells were used.
Charts should be generated from controlled ranges and labeled with units. Avoid manually typing values into a chart when the underlying dataset can be linked directly.

Using a Spreadsheet With a Report
A practical workflow is to maintain a clean spreadsheet containing raw observations, a separate calculation area, and a final summary area that feeds the report.
Keep a record of formulas and transformations. If a measurement is converted from one unit to another, document the conversion method.
Do not replace raw values with corrected values without preserving the original record. Corrections should be traceable.
When a graph is transferred into a report, check the axis labels, units, legend, and numerical values again. A visually correct chart can still contain an incorrect data range.
For collaborative work, define who is responsible for data entry, quality checks, calculations, visualization, and final integration.
Scientific Report Template Markdown
A scientific report template markdown workflow is useful for researchers who value plain-text source files, reproducibility, version control, and automated document generation.
Markdown separates content structure from visual styling. Headings, lists, tables, links, code blocks, and other elements can be written in a relatively simple text format and rendered into HTML or other outputs using suitable tools.
Markdown becomes especially powerful when combined with computational research. Data processing, statistical analysis, figures, narrative explanation, and output generation can be integrated into a reproducible workflow.
An R Markdown example of a scientific report demonstrates how structured headings, figures, tables, references, and scientific-style presentation can be integrated into a document-generation workflow.
Markdown is not automatically better than Word or Google Docs. Its main advantage is control and reproducibility, while its learning curve can be higher for users who prefer visual editing.

When Markdown Makes Sense
Markdown works well when the report is maintained alongside source code, datasets, analysis scripts, or version-controlled project files.
It is particularly attractive when the same content must be rendered into multiple formats, such as HTML and PDF, using a reproducible build process.
Researchers should nevertheless check how equations, references, tables, figures, page breaks, and institutional formatting requirements will be handled in the selected publishing toolchain.
A Markdown template should define the expected heading hierarchy, citation format, figure conventions, table conventions, and output requirements before substantial writing begins.
The resulting workflow can be highly efficient, but only when the team understands the tools and keeps the source files organized.
Scientific Report Template ETA 9179: An Important Distinction
The phrase scientific report template eta 9179 can create confusion because ETA-9179 is not a general scientific laboratory report template. It refers to the U.S. Department of Labor’s Joint Quarterly Narrative Performance Report associated with Workforce Innovation and Opportunity Act reporting.
The Department of Labor identifies ETA-9179 as a Quarterly Narrative Report and lists it under WIOA reporting requirements. Current reporting information also identifies an approved reporting period and provides PDF and DOC resources. :contentReference[oaicite:8]{index=8}
The form is therefore an example of structured narrative performance reporting rather than a template for laboratory science. It may appear in search results because it contains the words “report,” “template,” and “performance,” but that does not make it interchangeable with an academic scientific report.
This is an important SEO and research lesson: a keyword can describe a real document while still having an intent mismatch with the primary subject. Readers looking for a laboratory template should verify the purpose, issuing organization, audience, and reporting requirements before downloading anything.
If ETA-9179 is genuinely the required document for a grant or program, use the current official Department of Labor version rather than adapting a generic scientific template. Official requirements should always take precedence over general formatting advice.

Scientific Report Template ProjectManager
The phrase scientific report template projectmanager also represents an intent boundary. ProjectManager provides project-reporting templates for documents such as progress and status reports, which are designed to communicate project health, milestones, risks, tasks, costs, and related information.
Those reports can complement a scientific project, particularly when a research team needs to track milestones, deliverables, resources, risks, or stakeholder updates, but they are not substitutes for a scientific Methods, Results, and Discussion structure.
ProjectManager currently provides free project report templates in formats such as Word and Excel, and its reporting resources emphasize structured project information and stakeholder communication. :contentReference[oaicite:9]{index=9}
A research organization might therefore use two templates: a scientific report for technical findings and a project report for schedule, scope, budget, risks, and delivery status.
Keeping those purposes separate prevents project-management information from overwhelming the scientific argument while still giving managers the operational visibility they need.

Scientific Report Template eForms
The phrase scientific report template eforms can likewise refer to electronic forms rather than conventional scientific manuscripts. Electronic forms are useful for collecting standardized information, approvals, consent, metadata, and structured responses before those data become part of a research workflow.
For example, eForms provides a research informed consent form that is designed to collect standardized participant information and consent-related details and can be provided in formats including PDF and Word. :contentReference[oaicite:10]{index=10}
Electronic forms should not automatically be treated as scientific reports. A consent form records participant agreement and study information; a scientific report communicates the research process and findings.
The two can work together. A research project might use an electronic form for recruitment or consent, a spreadsheet or database for structured observations, analytical software for calculations, and a scientific report template for final communication.
This modular approach is usually more robust than trying to force every stage of a research workflow into one document.
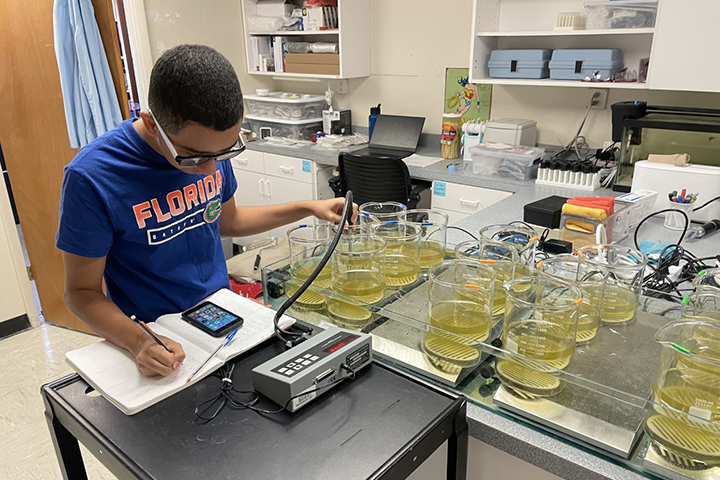
Data Analysis and Statistical Reporting
Analysis should be selected to answer the research question, not simply because a statistical test is available. The design of the study, variable types, assumptions, sample structure, and research objective all influence the appropriate method.
Descriptive statistics can summarize distributions, central tendency, and variability. Inferential methods can be used when the study design and assumptions justify drawing conclusions beyond the observed sample.
A report should identify the analysis performed and explain the role of the result. Simply reporting a p-value without context gives the reader little information about the scientific meaning of the finding.
Graphs and tables should complement the analysis. A statistical result should not be buried inside an oversized table if a concise figure communicates the important pattern more clearly.
Where uncertainty matters, report it. Confidence intervals, standard deviations, standard errors, measurement uncertainty, or other appropriate indicators can help readers judge the strength and precision of a result.

References and Source Management
References show where external knowledge came from. Every citation style has its own rules, but the essential principle is traceability: a reader should be able to identify the source supporting a claim.
Use primary research when the report needs to discuss specific experimental findings. Review articles, textbooks, standards, institutional guidance, and authoritative educational resources can provide broader context.
Do not cite a search-result page when the underlying source is available. Search engines help locate evidence, but they are not substitutes for the original publication, institutional document, or dataset.
Reference management software can reduce formatting errors in longer projects. Nevertheless, automated citations should be checked because metadata can contain incorrect authors, dates, titles, or publication information.
A template should reserve space for references but should not encourage unnecessary citations. Cite claims that require evidence and sources that materially inform the work.

Professional Quality Control
A report should undergo more than a spelling check before submission. Scientific quality control should examine whether the question, method, data, analysis, interpretation, and conclusion are logically connected.
First check factual consistency. Sample counts, dates, units, treatment names, figure numbers, and statistical values should agree throughout the document.
Next check numerical consistency. If a result is stated in the text, compare it against the table, graph, spreadsheet, or analysis output from which it originated.
Then check structural consistency. Every major section should answer a distinct question, and no important information should be hidden in an inappropriate section.
Finally, review the document as a reader who has never seen the experiment. Ask whether the report provides enough context to understand the evidence without relying on the author’s memory.

Common Scientific Report Mistakes
One of the most damaging mistakes is confusing a template with a complete methodology. A template provides structure; it does not guarantee that the experiment was designed correctly.
Another problem is filling every available field simply because it exists. If a section is irrelevant, adapt the structure rather than inserting meaningless text.
Excessive passive voice can also reduce clarity. Scientific style values precision more than grammatical tradition. Use the clearest construction that accurately identifies the action and actor.
Another common error is writing the Discussion as a second Results section. The Results should report evidence; the Discussion should interpret it and explain its implications.
Overdesigned reports create their own problems. Heavy graphics, decorative borders, inconsistent colors, oversized headings, and crowded pages can make technical information harder to inspect.

Practical Solution: A Reliable Scientific Reporting Workflow
Step 1: Define the reporting requirement. Before selecting a template, identify who will read the report, why it is being written, what format is required, and whether the institution, instructor, journal, funder, or client has mandatory sections.
Step 2: Build the report skeleton. Create the title, abstract, introduction, research question, methods, results, discussion, conclusion, references, and appendices that apply to the project. Remove sections that do not serve the research design.
Step 3: Establish the data structure. Decide where raw observations, processed datasets, calculations, statistical outputs, and final figures will live. Do this before writing the Results section.
Step 4: Write the Methods while the process is fresh. Record the actual procedure, not merely the planned procedure. Include relevant conditions, materials, equipment, samples, controls, and deviations.
Step 5: Analyze before interpreting. Complete the necessary calculations and statistical procedures before drafting the Discussion. This reduces the risk of deciding what the results “should” mean before seeing the evidence.
Step 6: Build figures from controlled data. Use consistent units, meaningful labels, appropriate chart types, readable captions, and clearly defined uncertainty indicators.
Step 7: Write the Discussion around evidence. Begin with the principal finding, compare it with the hypothesis or research question, consider alternative explanations, identify limitations, and explain what the evidence supports.
Step 8: Write the conclusion last. Reduce the entire investigation to its most important defensible finding. Do not introduce new evidence in the conclusion.
Step 9: Perform a traceability check. For every important numerical result, determine where it came from. For every important external claim, identify its source. For every figure, identify the dataset behind it.
Step 10: Perform a presentation check. Inspect page breaks, headings, captions, table alignment, equations, references, appendices, hyperlinks, and PDF conversion. The final file should look deliberate rather than automatically assembled.
Step 11: Perform a scientific integrity check. Confirm that unexpected results have not been removed without justification, that conclusions do not exceed the evidence, and that limitations are stated honestly.
Step 12: Archive the supporting material. Preserve the relevant dataset, analysis file, version of the template, source references, and final report according to the project’s retention requirements.

Recommended Template Architecture
A practical master template can begin with document metadata, followed by the title and abstract. This provides a predictable opening while leaving the scientific content adaptable to the project.
The next layer should contain Introduction, Research Question or Aim, Hypothesis where appropriate, and Methods. These sections establish the logic and reproducibility of the investigation.
The Results section should provide dedicated styles for tables, figures, equations, and short explanatory paragraphs. This prevents visual evidence from becoming disconnected from the written argument.
The Discussion and Conclusion should remain text-focused. Avoid creating dozens of decorative layout options that encourage inconsistent formatting.
References and appendices should come at the end, with clear numbering and navigation. A long report may also need a list of figures, list of tables, glossary, or document history.
How to Choose the Right Format
Choose Word when the report requires extensive prose, tracked changes, conventional academic formatting, or DOCX delivery.
Choose Google Docs when real-time browser collaboration is more important than highly specialized document automation.
Choose Excel when structured calculations, data entry, formulas, and charts are central to the workflow, while using another document format for the narrative if necessary.
Choose Markdown or a reproducible document system when the research depends heavily on code, version control, automated analysis, or repeated rendering.
Choose PDF as the final distribution format when preserving the appearance of the completed report is important. It is usually better to maintain an editable source file separately.
Reference Examples
The following examples illustrate the kinds of visual resources associated with the requested template formats and search intents. They should be treated as reference visuals rather than evidence that every resource is free, editable, officially required, or appropriate for every scientific discipline.
scientific report template word
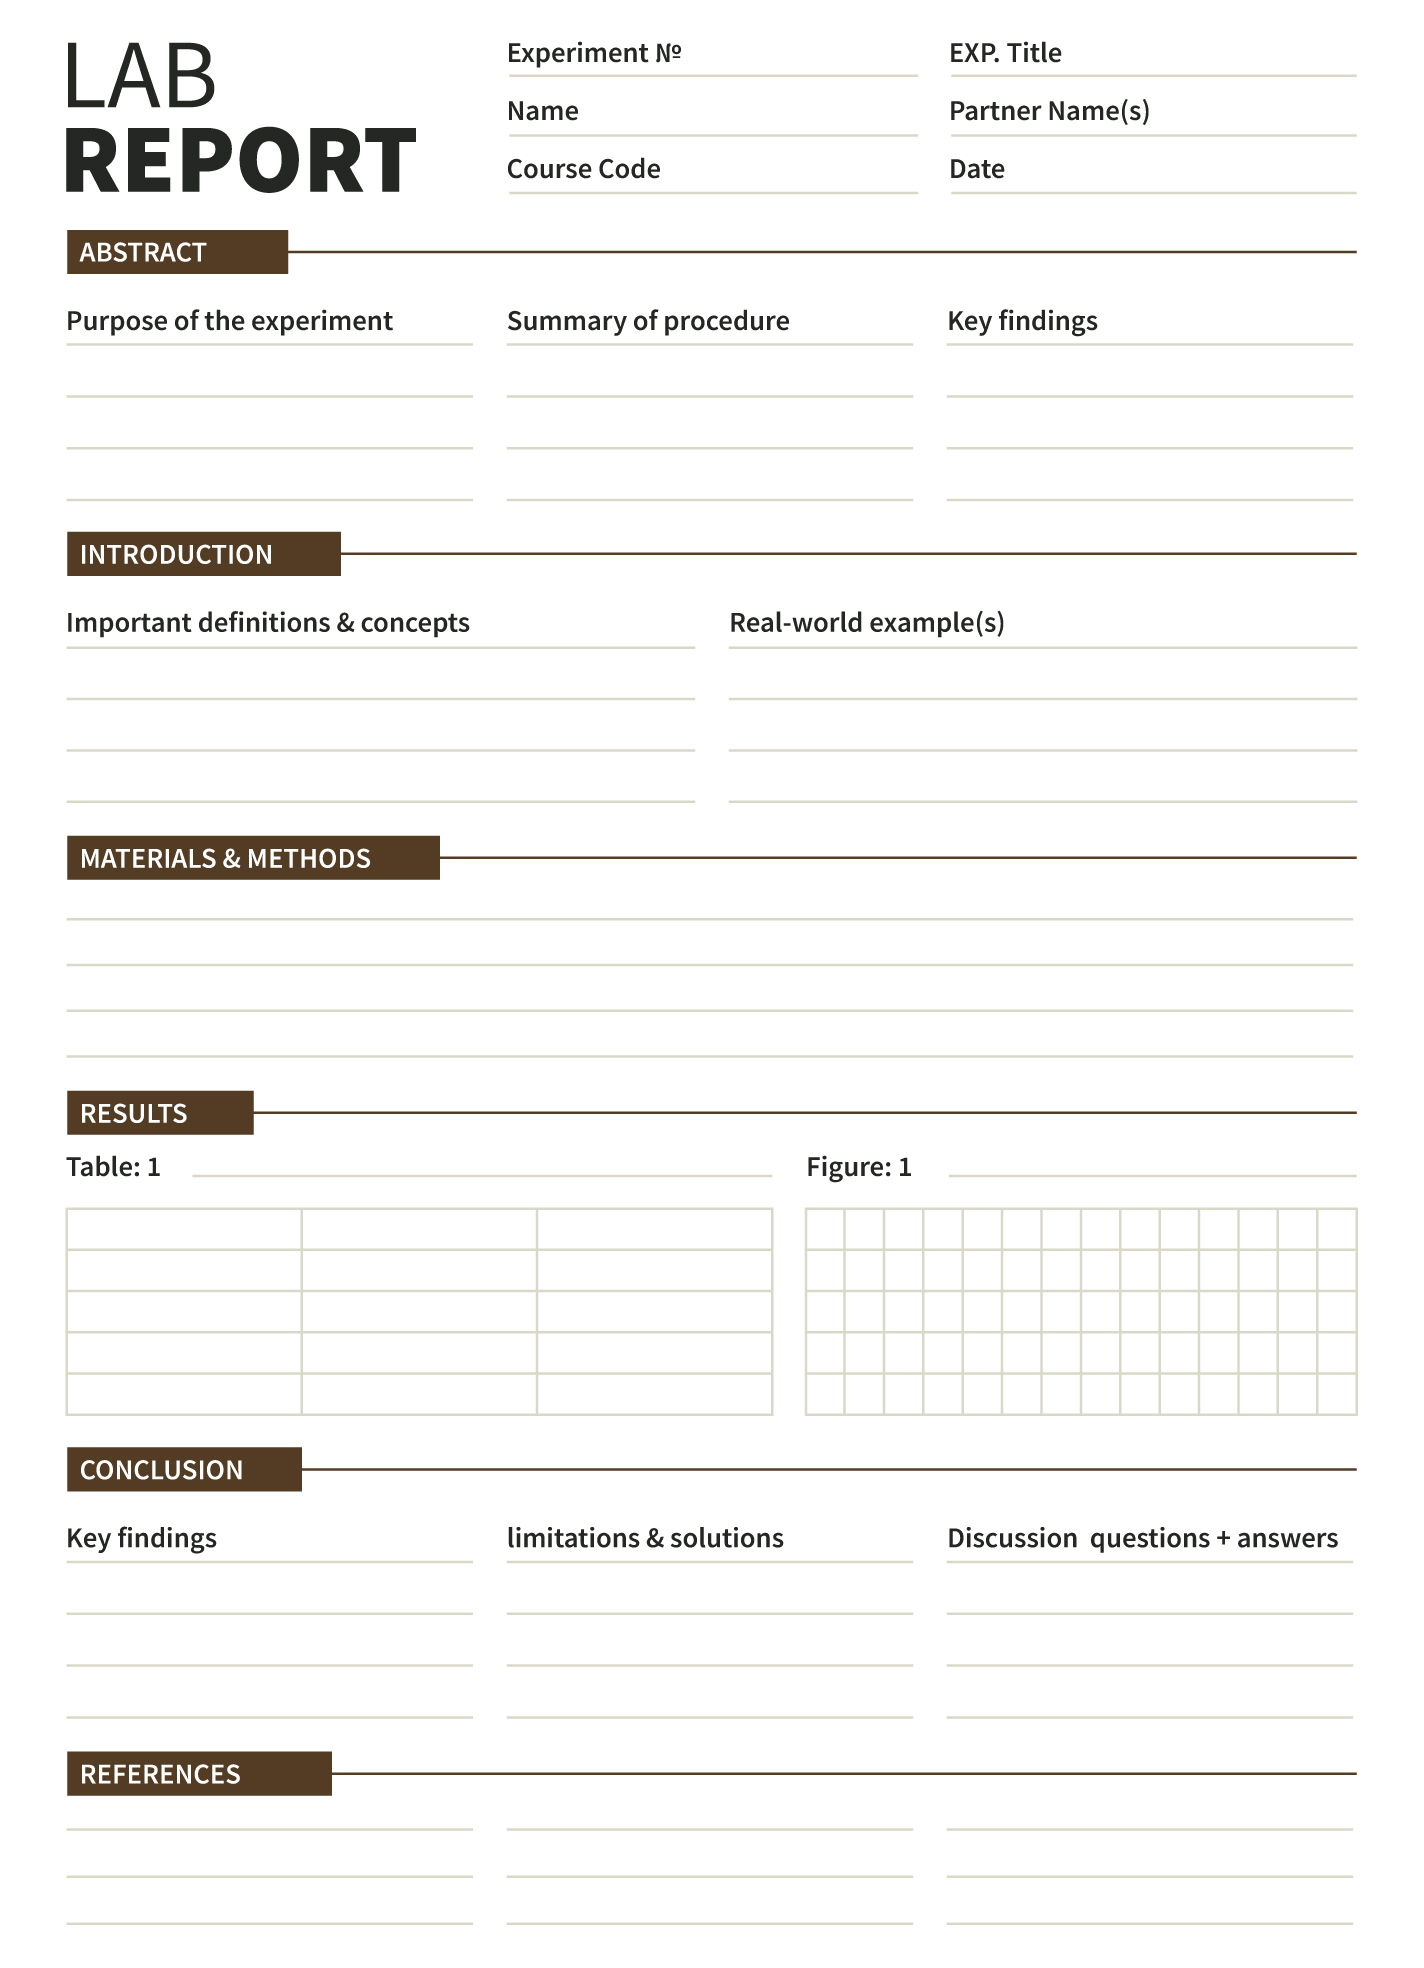
Source: gdoc.io.
scientific report template word free download

Source: Etsy.
scientific report template google docs

Source: Wikimedia Commons.
scientific report template for students

Source: Studocu.
scientific report template pdf
Source: Wikimedia Commons.
scientific report template excel
Source: Wikimedia Commons.
scientific report template markdown
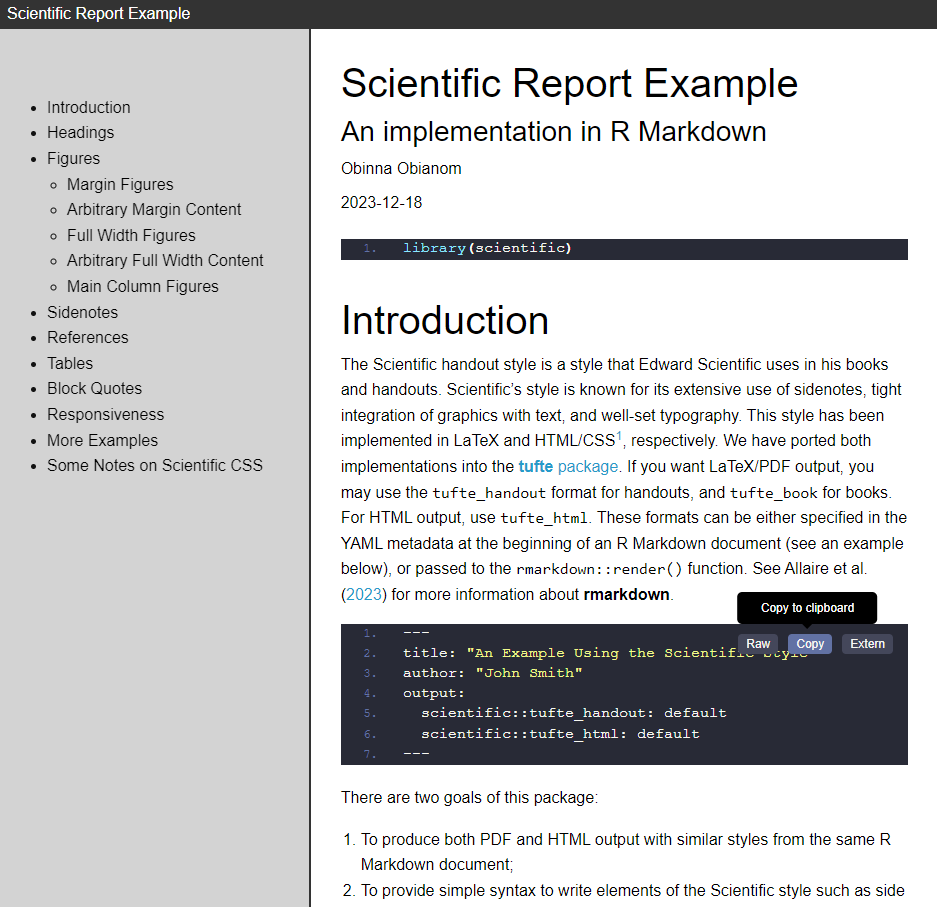
Source: Scientific package documentation by Obinna Obianom.
scientific report template eta 9179
Source: Epic Essay; illustrative reporting and data-analysis visual, not an official ETA-9179 form.
scientific report template projectmanager

Source: ProjectManager template visual as reproduced by RoyalCDKeys.
scientific report template eforms
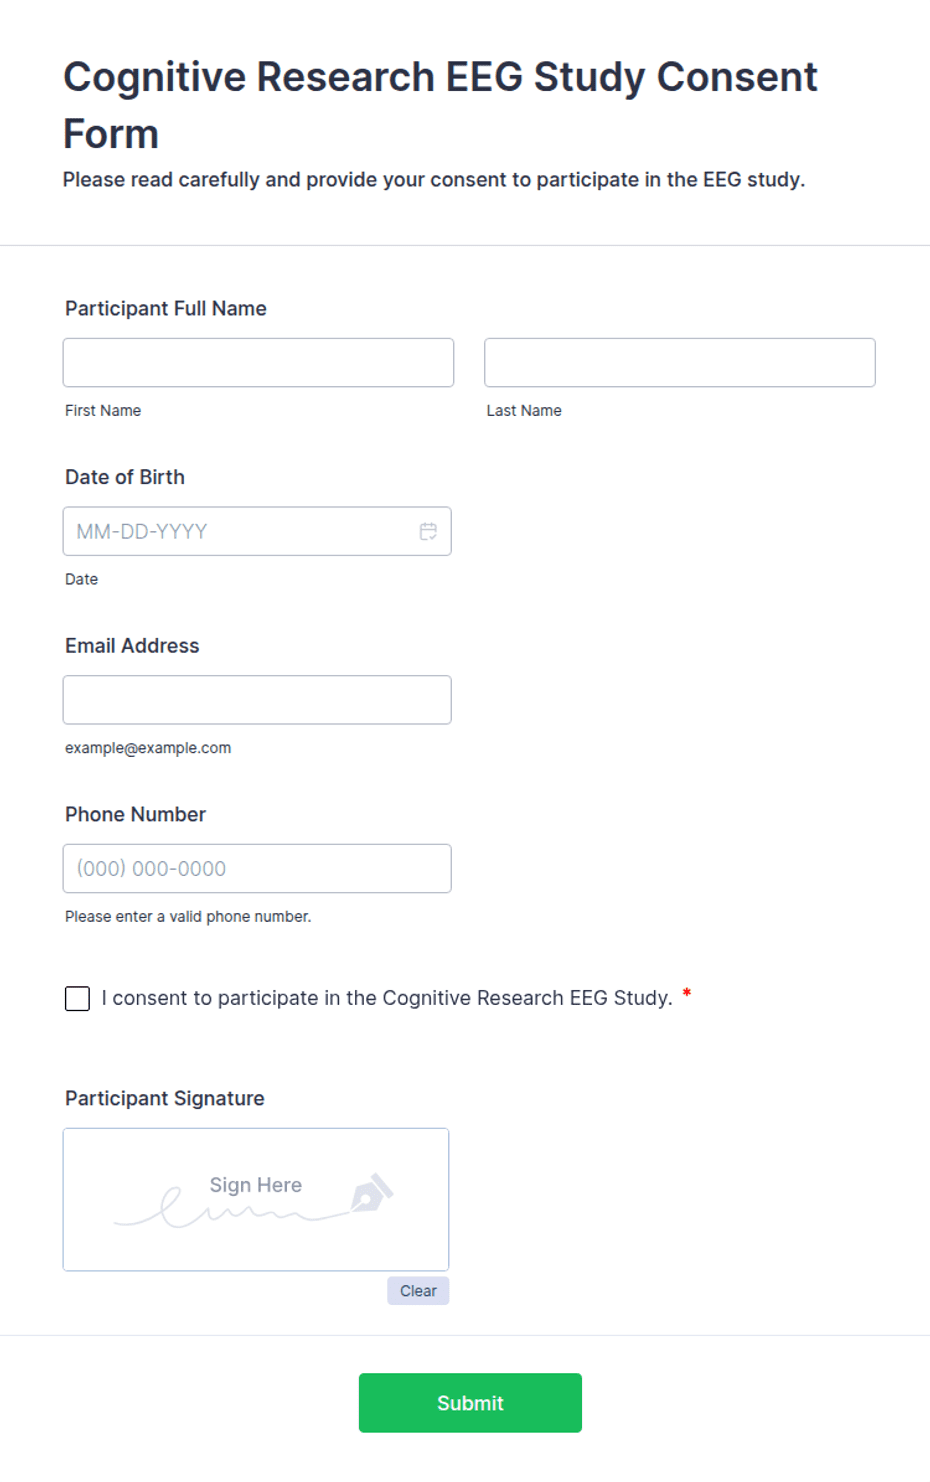
Source: Jotform; illustrative electronic research-form example.
Frequently Asked Questions
What should a scientific report template include?
A flexible template normally includes a title, abstract when required, introduction, research question or aim, hypothesis when appropriate, methods, results, discussion, conclusion, references, and appendices. Additional sections should reflect the discipline and assignment rather than being added simply because a template contains them.
Is IMRaD required for every scientific report?
No. IMRaD—Introduction, Methods, Results, and Discussion—is a widely used structure for empirical research, but disciplines and institutions may combine, rename, add, or omit sections. Always follow the requirements of the relevant course, journal, organization, or research project. :contentReference[oaicite:11]{index=11}
Should I write the Methods section in detail?
Yes, but detail should be relevant. Include enough information for a scientifically competent reader to understand how the study was conducted, how data were collected, and how they were analyzed. Avoid irrelevant procedural trivia.
Should raw data be included in the main report?
Not necessarily. Important summaries normally belong in the Results section, while extensive raw datasets can be provided in appendices or an appropriate repository when required. The report should make the relationship between raw data and reported findings traceable.
Can I use the same template for every experiment?
You can use a master template, but it should be adapted to each investigation. A chemistry experiment, field survey, computational study, and clinical research project may need different subsections and documentation requirements.
Is a Word template better than a Google Docs template?
Neither is universally better. Word is often strong for advanced document formatting and DOCX workflows, while Google Docs is convenient for browser-based collaboration. The better choice depends on the assignment, team, delivery format, and required features.
Can Excel replace a scientific report?
Usually not. Excel is excellent for data entry, calculations, analysis, and visualization, but a scientific report also needs narrative context, methodology, interpretation, limitations, and conclusions. A spreadsheet and a document can work together effectively.
When should I use Markdown?
Markdown is particularly useful when research is connected to code, reproducible analysis, version control, or automated document generation. It can be less convenient when collaborators expect traditional visual editing or highly specialized word-processing features.
What is ETA-9179?
ETA-9179 is a U.S. Department of Labor Joint Quarterly Narrative Performance Report associated with WIOA reporting. It is not a generic scientific laboratory-report template. The official Department of Labor reporting page lists the current Quarterly Narrative Report under its WIOA reporting materials. :contentReference[oaicite:12]{index=12}
How long should a scientific report be?
There is no universal length. A short teaching laboratory report may be only a few pages, while a research project report can be substantially longer. The appropriate length is the amount needed to explain the research clearly without omitting necessary evidence or adding irrelevant material.
What makes a scientific report credible?
Credibility comes from a defensible research design, transparent methods, accurate data handling, appropriate analysis, honest interpretation, clear limitations, and traceable sources. Formatting improves readability, but formatting alone cannot make weak evidence scientifically strong.
Conclusion
The most effective scientific report template is a practical framework that makes scientific reasoning easier to communicate. It gives every important part of the investigation a logical place while remaining flexible enough to accommodate different disciplines, research designs, audiences, and delivery formats.
For most empirical work, the central structure remains straightforward: explain the problem, establish the context, describe the method, present the evidence, interpret the findings, and state a conclusion that matches the strength of the evidence.
Format should support that logic rather than distract from it. Word, Google Docs, Excel, PDF, and Markdown each have legitimate roles, but the correct choice depends on whether the priority is narrative editing, collaboration, data analysis, distribution, or reproducibility.
Template names can also be misleading. A resource associated with a student laboratory, a project-management platform, an electronic form system, or the ETA-9179 government reporting process may all contain the word “report,” yet serve very different purposes. Verifying the intended audience and document function is therefore just as important as checking the file format.
A reliable workflow starts with the research question and ends with a quality-controlled document. Keep raw evidence traceable, separate results from interpretation, use figures and tables purposefully, document limitations honestly, and adapt the template to the actual requirements of the investigation.
When those principles are built into the document from the beginning, a scientific report becomes more than a formatted assignment: it becomes a durable record of how the investigation was conducted, what the evidence showed, how confidently the findings can be interpreted, and what should happen next.
