Templates are especially valuable when research has to move between formats. A team may collect responses in a spreadsheet, analyze them in Excel, write the narrative in Word, export a PDF, present selected findings to executives, and provide a client-ready version. The underlying research should remain consistent even when the presentation changes.
This guide explains what a useful market research report template contains, how to choose between Word, Excel, printable, and digital formats, how to build a report from raw research, and how to avoid common reporting mistakes. It also covers government-oriented research and practical ways to share findings with stakeholders.
The goal is not to create the longest possible document. The goal is to create a report that lets a reader understand what was investigated, how the evidence was obtained, what the evidence means, and what should happen next. That principle should guide every template decision.

What is a market research report template?
A market research report template is a pre-structured document used to organize the output of a research project. It normally provides headings, prompts, tables, and spaces for findings rather than requiring the researcher to design the report from a blank page.
The template is different from a questionnaire. A questionnaire gathers information from respondents, while the report organizes and interprets the information after collection. It is also different from a research plan, which normally describes what will be studied, why it matters, how the work will be conducted, and when it will be completed.
A useful template establishes a logical relationship between the research objective and the final recommendation. If the project asks whether a company should enter a new customer segment, the report should make it easy to connect market size, customer need, competitive pressure, buying behavior, risks, and the proposed decision.
Templates also establish consistency. When several analysts prepare reports using the same structure, executives know where to find methodology, findings, assumptions, limitations, and recommendations. That consistency becomes increasingly valuable when research is conducted repeatedly across products, regions, customer groups, or time periods.
Good structure should never become a substitute for judgment. A beautifully formatted report can still be weak if its research question is vague, sources are poorly documented, sample limitations are ignored, or recommendations are disconnected from the evidence. The template should support analytical discipline, not disguise its absence.

Why a structured template improves market research
Research projects often begin with scattered information. One person may have interview notes, another may maintain a spreadsheet, another may collect competitor screenshots, and a manager may have the original business question in an email. A template provides a common destination for these inputs.
Structure also reduces the risk of omitting important context. Without prompts, researchers may emphasize interesting findings while forgetting to explain sample selection, research dates, geographic scope, definitions, assumptions, or limitations. A standardized format creates deliberate places for those details.
A template can improve review quality as well. A manager reviewing several projects can compare methodology, evidence, findings, and recommendations using a familiar structure. That makes it easier to identify unusual results, unsupported assumptions, inconsistent definitions, or conclusions that deserve additional investigation.
The format also supports version control. Research can evolve as interviews are completed, survey responses arrive, secondary sources are validated, and analytical models are revised. A consistent report structure gives contributors a stable framework even while individual data points change.
Finally, templates save cognitive effort. Researchers should spend their time deciding what the evidence means rather than repeatedly deciding where a methodology paragraph belongs or how to format the findings page. The more repeatable the research process becomes, the more valuable a well-designed template can be.

Core components of a market research report
A practical report normally begins with a title page or document header identifying the research subject, organization, date, author, and relevant project information. The title should be specific enough that a reader understands the study without opening several additional pages.
The executive summary follows. It should state the business question, the most important evidence, the principal conclusion, and the recommended action. Although it appears near the beginning, it is often easier to write after the detailed analysis is complete.
The introduction and objectives section explains why the study exists. It should distinguish the business problem from the research problem. For example, declining sales are a business problem, while understanding which customer segments have changed their purchasing behavior may be the research problem.
The methodology section describes how evidence was collected and analyzed. Depending on the project, that can include surveys, interviews, focus groups, observations, internal data, competitor research, public statistics, industry publications, or other secondary sources.
The findings section presents the evidence, while the discussion interprets it. Recommendations then convert the interpretation into action. Appendices can hold questionnaires, detailed tables, interview guides, technical notes, source lists, calculations, or other material that supports the report without interrupting its main narrative.

How to design the executive summary
The executive summary should answer the reader’s most important question immediately: what did the research discover and what should the organization do about it? Avoid beginning with a long description of the research process when the decision is more important to the audience.
A useful summary can state the objective in one short paragraph, identify several major findings, and close with the recommendation. If a reader has only two minutes, the summary should still communicate the basic logic of the research.
Do not introduce evidence in the executive summary that never appears in the main report. Every major claim should be traceable to a finding, calculation, source, or clearly labeled assumption elsewhere in the document.
Keep terminology accessible. Senior stakeholders may understand the business context without knowing specialized statistical language, sampling terminology, or research abbreviations. If technical terms are essential, define them rather than assuming that every reader shares the researcher’s vocabulary.
The summary should also distinguish findings from recommendations. A statement such as “respondents rated delivery speed as a major purchase factor” describes evidence. A statement such as “increase investment in fulfillment capacity” is a recommendation based on that evidence. Keeping the distinction visible strengthens credibility.

Define the research objective before collecting data
A strong report starts with a precise question. “Understand the market” is too broad to determine what information should be collected. “Determine whether mid-sized retailers have a strong enough need for automated inventory forecasting to justify a new product tier” gives the research team a much clearer direction.
The objective should identify the decision the research is intended to inform. This prevents the project from becoming a general information-gathering exercise where interesting facts accumulate without contributing to a business choice.
Next, establish the scope. Define the geography, customer population, product category, time period, competitive set, and other boundaries that affect interpretation. A market estimate without a clear definition can appear precise while answering a different question from the one stakeholders actually care about.
Research questions should then be derived from the objective. For a pricing study, questions might cover willingness to pay, current alternatives, perceived value, price barriers, and competitive price expectations. For market entry, questions might focus on demand, customer accessibility, competitive intensity, regulation, distribution, and operational feasibility.
Write the decision statement before building the questionnaire or analysis workbook. This simple discipline makes it easier to reject irrelevant data and ensures that the final report has a clear destination from the beginning.

Document methodology clearly
Methodology is not administrative decoration. It tells readers how the evidence was produced and gives them the information needed to judge whether the conclusions are appropriate for the decision.
For survey research, document the target population, recruitment approach, field dates, sample size, relevant screening criteria, questionnaire structure, and major analytical methods. If the sample is not representative of the intended market, state that limitation rather than allowing readers to infer representativeness.
For interviews, describe who was interviewed, why those participants were selected, how the conversations were conducted, and how notes or transcripts were analyzed. Qualitative research can provide rich insight, but a small set of interviews should not automatically be presented as statistically representative.
For secondary research, record the source, publication date, relevant geography, definitions, and any transformations applied to the data. When several sources disagree, explain how the discrepancy was investigated instead of silently selecting the number that supports the preferred conclusion.
Limitations belong in the methodology or a dedicated limitations section. Examples include small samples, missing data, uncertain market definitions, self-reported behavior, changing competitive conditions, unavailable historical information, or assumptions required to estimate market size.

Build the market overview
The market overview provides context before the report moves into detailed customer or competitive findings. It can describe the category, major segments, geographic boundaries, relevant trends, business models, distribution channels, and factors that influence demand.
Market size should be defined rather than presented as a standalone number. A report may distinguish a total market from the portion that fits the company’s product category, target geography, customer segment, or operational capabilities.
When using market-size estimates, show the logic behind them. A simple calculation based on number of potential customers multiplied by an estimated annual spend may be useful if the assumptions are explicit. Readers should be able to understand which inputs are observed and which are estimated.
Market trends should also be separated from predictions. Historical growth is evidence about what has happened. A forecast is an estimate about what may happen. The report should identify the difference so readers do not mistake an assumption for a measured fact.
The market overview should be concise enough to remain useful. Its purpose is to establish the environment in which the research findings should be interpreted, not to reproduce every article or industry report discovered during the project.

Segment customers intelligently
Segmentation is useful when different groups behave differently enough to require different decisions. A segment might be defined by company size, use case, industry, geography, buying frequency, needs, maturity, budget, or another meaningful characteristic.
Do not create segments simply because a dataset contains many demographic fields. A segment should help explain behavior or support an action. If two groups have identical needs, purchase patterns, and commercial potential, separating them may add complexity without adding insight.
Customer profiles should combine descriptive and behavioral information. Demographics can provide context, but purchase triggers, pain points, decision criteria, barriers, and preferred channels often provide more useful guidance for product and marketing decisions.
When sample sizes become small, be careful with subgroup conclusions. A visually dramatic difference between two small groups may not be reliable. The report should identify whether an observed pattern is robust, directional, or exploratory.
A good template can include a standard segment table with fields for segment definition, size, needs, behaviors, purchase drivers, barriers, competitive preferences, and strategic implications. That creates a repeatable framework for comparing customer groups.
Use Excel for research data and analysis
A spreadsheet is often the most practical working environment for quantitative research. It can hold cleaned responses, coding schemes, calculations, cross-tabulations, competitor observations, assumptions, and supporting analysis while the final narrative remains in a document.
When deciding on a market research report template to use in excel, focus on how the workbook separates raw data from calculations and presentation. Keeping source data untouched makes later auditing and correction much easier.
A useful workbook can include separate sheets for raw responses, data dictionaries, cleaning rules, calculated fields, summary tables, charts, assumptions, and report-ready outputs. The exact arrangement depends on the research, but separation reduces accidental changes to source data.
Use consistent labels and definitions. If one worksheet calls a customer segment “SMB” and another calls it “small business,” document whether those terms mean exactly the same thing. Inconsistent categories can produce misleading summaries even when the formulas themselves are correct.
Excel is especially useful for scenario analysis. For example, a market-sizing worksheet can allow the analyst to change customer counts, conversion assumptions, annual spending, or adoption rates and immediately see how the estimate changes.

Turn spreadsheet analysis into report-ready findings
The spreadsheet should not become the final report simply because it contains all the numbers. Tables are useful for checking evidence, but stakeholders often need interpretation rather than a screen full of cells.
Start each finding with the conclusion. Instead of presenting a table and asking the reader to identify the pattern, state what the table demonstrates and then show the supporting numbers.
Charts should answer a question. A bar chart can compare segments, a line chart can show a time trend, a stacked chart can show composition, and a scatter plot can reveal relationships. The visual form should follow the analytical task rather than personal design preference.
Every important chart should have a clear title, understandable units, an appropriate time period, and enough context to prevent misinterpretation. Avoid unnecessary decorative elements that make the evidence harder to read.
The report should also retain access to the underlying analysis. An executive reader may need only the headline chart, while an analyst may need to inspect the calculation. A well-organized workbook and a concise report serve these different needs together.

Analyze competitors without creating a data dump
Competitive analysis should focus on dimensions that matter to customers and to the decision being made. Listing dozens of competitors without explaining their relevance produces a long appendix rather than useful intelligence.
For each important competitor, consider positioning, target customers, product or service scope, pricing approach, distribution, strengths, weaknesses, and evidence of market traction where reliable information is available.
Competitive claims require particular care. Public descriptions can reveal what a company says about itself, but they do not automatically prove customer satisfaction, market share, product superiority, or commercial success.
A competitive matrix can help identify meaningful differences. Choose dimensions that reflect buyer priorities rather than dimensions selected only because information is easy to collect. If price and implementation speed drive purchasing decisions, they may be more useful than a long list of superficial features.
The strongest competitive section connects competitors back to the research objective. The question is rarely “Who are the competitors?” It is more often “Which alternatives threaten this opportunity, why do customers choose them, and where is there credible room to compete?”

Interpret customer evidence
Customer evidence can include survey percentages, interview themes, verbatim comments, behavioral data, support records, purchase patterns, and other observations. Each type has different strengths and should be interpreted accordingly.
Quantitative findings are useful for measuring prevalence and comparing groups. Qualitative findings can explain motivations, language, frustrations, and context that a closed-ended question may not capture.
Do not treat a memorable customer quote as proof that an entire market thinks the same way. A quote can illustrate a theme, but the report should explain how representative or exploratory that theme is.
Similarly, survey percentages should not be presented without considering question wording, response options, sample composition, and the context in which respondents answered. A precise percentage can still be misleading if the underlying measurement is weak.
The best reports combine evidence types. If interviews reveal a recurring pain point and survey data indicates that the pain point is widespread, the two sources reinforce each other. If they conflict, the disagreement becomes a research question rather than something to hide.

Market sizing, assumptions, and scenarios
Market sizing is one of the areas where a template can provide significant value because assumptions are easy to lose when calculations move between spreadsheets, presentations, and written reports.
Document the definition of the market before showing the estimate. State whether the number represents revenue, units, customers, transactions, or another measure. Include the geographic area and time period so readers know exactly what the estimate represents.
Show major assumptions separately from observed inputs. For example, a hypothetical estimate might use a known number of potential businesses but assume an annual purchase value. The number of businesses may be measured while the purchase value is an analytical assumption.
Scenario analysis can be more useful than a single point estimate. A report might show conservative, central, and higher-demand cases when uncertainty is substantial. The purpose is not to create false precision but to demonstrate how the decision changes under different conditions.
Every scenario should explain what changes. If only adoption changes, keep other inputs constant unless the scenario explicitly models several variables. This makes the analysis easier to challenge and easier to update when new information arrives.

Choose Word when the narrative matters
Word is usually better than a spreadsheet for the final narrative because it supports headings, long-form explanations, page structure, tables, references, and document review. It is particularly useful when the report needs to be read from beginning to end.
A market research report template to use in word should provide enough structure to maintain consistency without locking the researcher into irrelevant sections. A pricing study does not necessarily need the same layout as a multi-country market-entry report.
Use heading styles consistently so the document can generate navigation and a table of contents when appropriate. Standardized headings also make it easier for multiple authors to work on a single report without creating inconsistent formatting.
Tables should summarize information rather than reproduce entire datasets. If a table becomes too large to read comfortably, move the detailed version into an appendix and keep the main report focused on the comparison that matters.
Before delivery, review page breaks, figure references, headings, footnotes, tables, and appendices. A technically correct analysis can appear less credible if the document contains broken pagination, inconsistent terminology, or charts separated from the explanation that gives them meaning.

When to create a printable version
Digital-first reports should still be designed with print in mind when stakeholders may annotate, circulate, archive, or review physical copies. A printable layout is especially useful for formal meetings, workshops, client reviews, and document-heavy approval processes.
A market research report template to print should use readable body text, sensible margins, page numbers, consistent headings, and charts that remain understandable without excessive color or interactive features.
Do not rely on hyperlinks as the only way to understand a figure. A printed report should still explain what each chart means and identify important sources or notes near the relevant evidence.
Check tables for page breaks. A table with its header on one page and most of its rows on another can be difficult to interpret. Long tables may need repeated headers or a deliberate appendix layout.
Finally, inspect the exported PDF rather than assuming that the source document and final file are identical. Font substitutions, page breaks, chart rendering, and image scaling can change during export.
Use visual storytelling without overstating the evidence
Visuals help readers recognize patterns quickly, but visual design can also exaggerate differences. The scale, axis, category order, and chart type should all support accurate interpretation.
A market research report benefits from a deliberate visual hierarchy. The most important finding should be visually prominent, while supporting numbers can remain smaller. This helps readers distinguish the decision-driving evidence from background information.
Charts should have enough labels and context to stand on their own when separated from the surrounding paragraph. Include units, dates, segment definitions, and relevant sample information when those details affect interpretation.
Avoid decorative charts that communicate little. A complicated infographic may look impressive while making it harder to identify the actual result. In many situations, a simple bar chart with a clear headline is more useful than an elaborate illustration.
When multiple charts are used, keep terminology and category definitions consistent. If one chart groups customers by company size and another uses a different classification, explain the difference so readers do not compare incompatible categories.

Use interviews as evidence, not decoration
Interviews can reveal why customers behave in ways that quantitative data alone cannot explain. They are useful for discovering unmet needs, understanding decision processes, testing language, and exploring unexpected findings from surveys or behavioral data.
A structured interview guide should connect each question to a research objective. Questions that do not contribute to the decision may still be interesting, but they consume respondent time and increase the amount of material that must later be analyzed.
Interview notes should distinguish what participants actually said from the researcher’s interpretation. This is particularly important when several analysts code the same interviews because interpretation can otherwise become inconsistent.
When presenting qualitative findings, group observations into themes and explain how the themes were identified. A report can also include selected quotations when they clarify the customer’s language, but quotes should not replace synthesis.
If the study includes interviews with customers, employees, experts, or channel partners, the report should identify the participant type and relevant selection criteria while protecting confidential information where required.

Government and DoD-oriented market research
The phrase market research report template dod usually refers to a government acquisition context rather than a generic commercial marketing report. That distinction matters because procurement research has documentation and decision-support needs that may differ from ordinary product research.
A U.S. Department of Defense market research guide has described a common framework for documenting acquisition-related market research, including requirement information, market and industry analysis, and conclusions or recommendations. The guide also recognizes that the extent of research can vary with factors such as urgency, complexity, value, and previous experience.
That means a government-oriented template should not automatically be treated as a universal form. Researchers should distinguish an official requirement from a convenient example structure and verify the current policy or contracting guidance applicable to the specific acquisition.
For procurement research, source documentation is particularly important. Record vendor information, sources reviewed, market conditions, small-business considerations when applicable, relevant contract vehicles, and other research activities in a way that another reviewer can understand.
The practical lesson is simple: if a project has an official reporting requirement, use the current authoritative guidance as the controlling source. A generic template can help organize thinking, but it should not override an agency’s current instructions.

What to include in a client-ready report
A client-facing report should be understandable to someone who did not participate in the research. That means defining specialized terms, explaining assumptions, identifying limitations, and making the recommendation visible without requiring the client to reconstruct the analysis.
Client reports should also distinguish between information supplied by the client and information independently collected by the research team. This is particularly important when internal sales data, customer lists, proprietary estimates, or management assumptions are combined with external research.
The report should make evidence traceable. A reader should be able to determine where important numbers came from, how derived figures were calculated, and which statements represent interpretation rather than direct measurement.
Formatting should reinforce the client’s brand without overwhelming the research. Consistent typography, restrained visual treatment, clear charts, and predictable navigation generally make a document easier to use than excessive decoration.
Before sharing the final version, perform a client-readiness review. Check names, dates, company references, confidentiality markings, citations, figures, calculations, recommendations, and appendices. The final review should include someone who was not deeply involved in producing the document.
Practical Solution: a repeatable market research reporting workflow
The most effective solution is to build the report as part of the research process rather than waiting until the end. Start by creating the report skeleton immediately after the research objective is approved, then use each section as a destination for evidence as it is collected.
Step one is to write a one-sentence decision statement. Step two is to list the research questions required to resolve that decision. Step three is to map each question to a method, source, dataset, or interview topic. This creates a direct chain from decision to evidence.
Step four is to establish a research log. Record sources, dates, definitions, assumptions, decisions, exclusions, and unresolved questions. A simple log prevents researchers from repeatedly rediscovering the same information and makes later fact-checking much faster.
Step five is to analyze evidence before writing conclusions. Clean quantitative data, code qualitative themes, compare segments, evaluate competitors, test assumptions, and document uncertainty. The recommendation should emerge from this process rather than being selected first and justified afterward.
Step six is to build a decision-focused executive summary. State what the evidence supports, what remains uncertain, and what action is recommended. Step seven is to produce the appropriate stakeholder versions: detailed working report, executive summary, printable PDF, presentation extracts, or client-facing deliverable.
Step eight is to archive the supporting material. Preserve the final dataset, methodology notes, source list, calculation workbook, interview guide, and approved report version according to the organization’s retention and confidentiality practices.
This workflow makes the market research report template to use in business more than a document design choice. It becomes a repeatable operating system for research: define, collect, validate, analyze, interpret, recommend, communicate, and preserve.
Reference Examples
The examples below pair each requested search phrase with a visually relevant public image source. They illustrate the types of documents, formats, and workflows associated with each use case; they are not claims that the pictured resource is an official requirement or a free downloadable file unless the source itself says so.
market research report template dod

Source: Wikimedia Commons, United States Department of Defense logo.
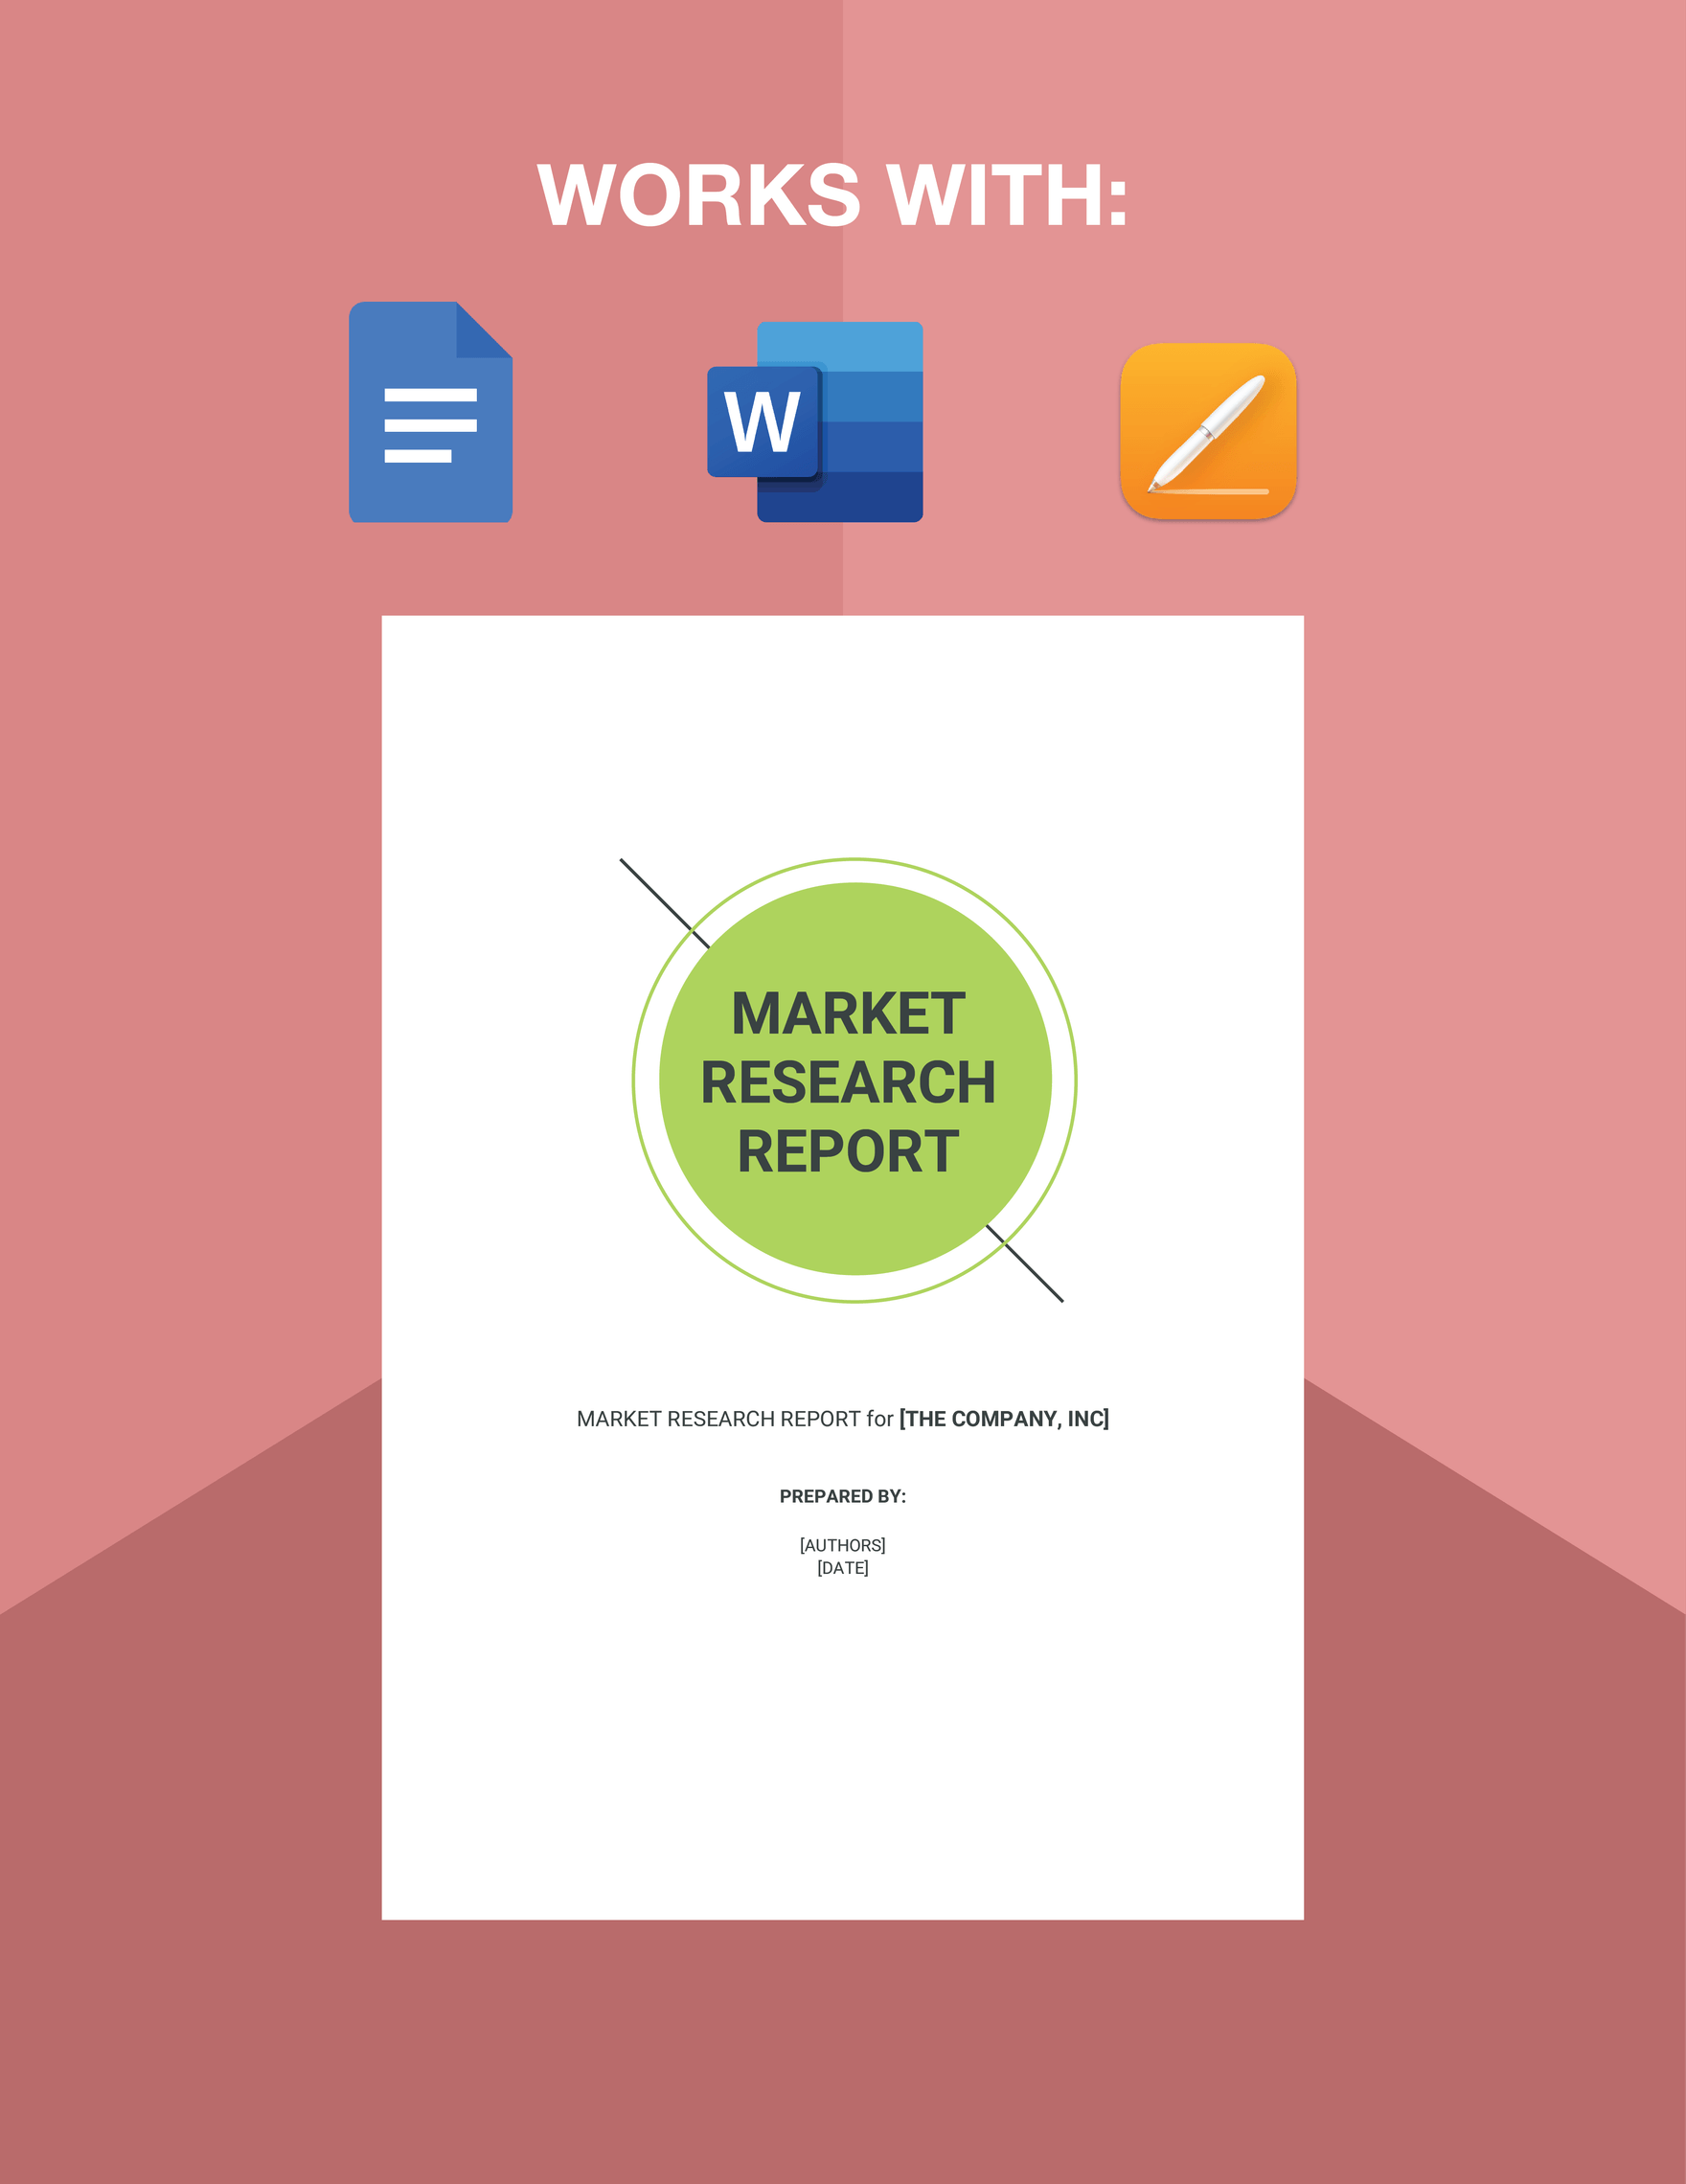
market research report template

Source: Template.net.
market research report template to download

Source: Template.net.
market research report template to use in excel
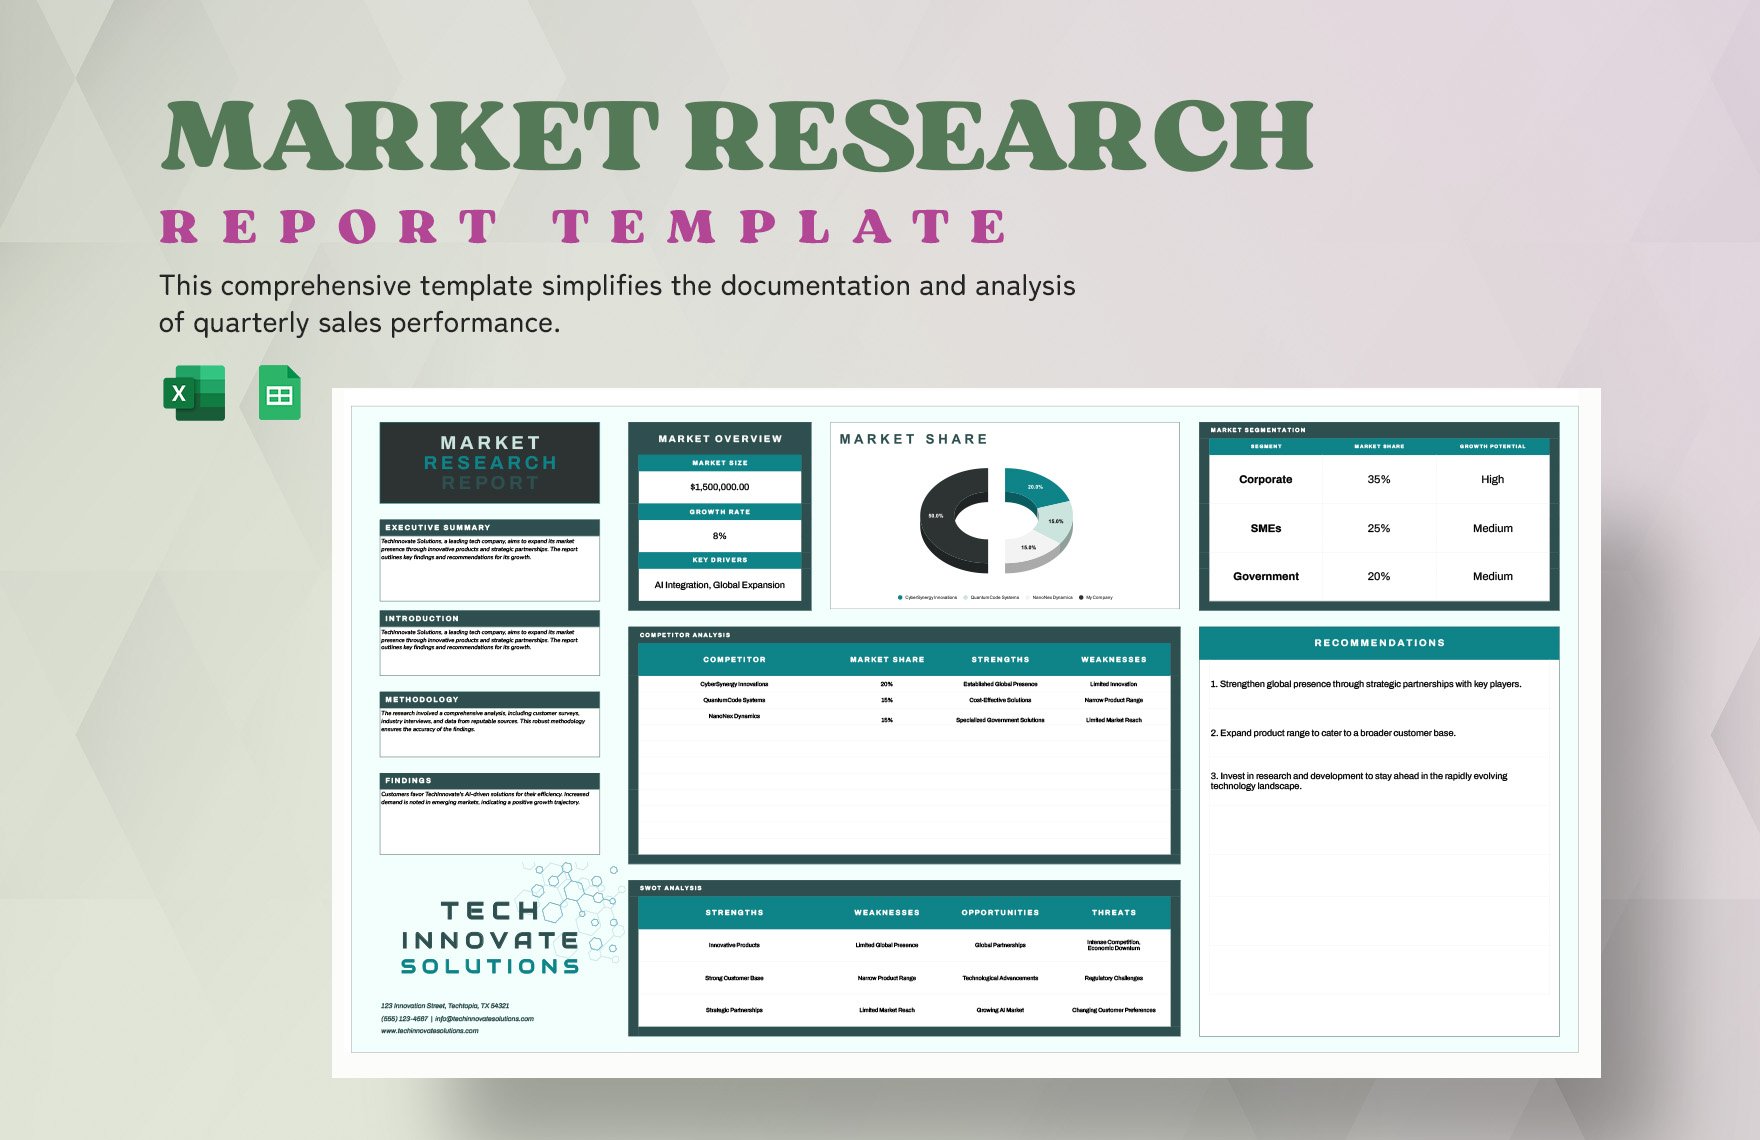
Source: Template.net.
market research report template to use in business

Source: Template.net.
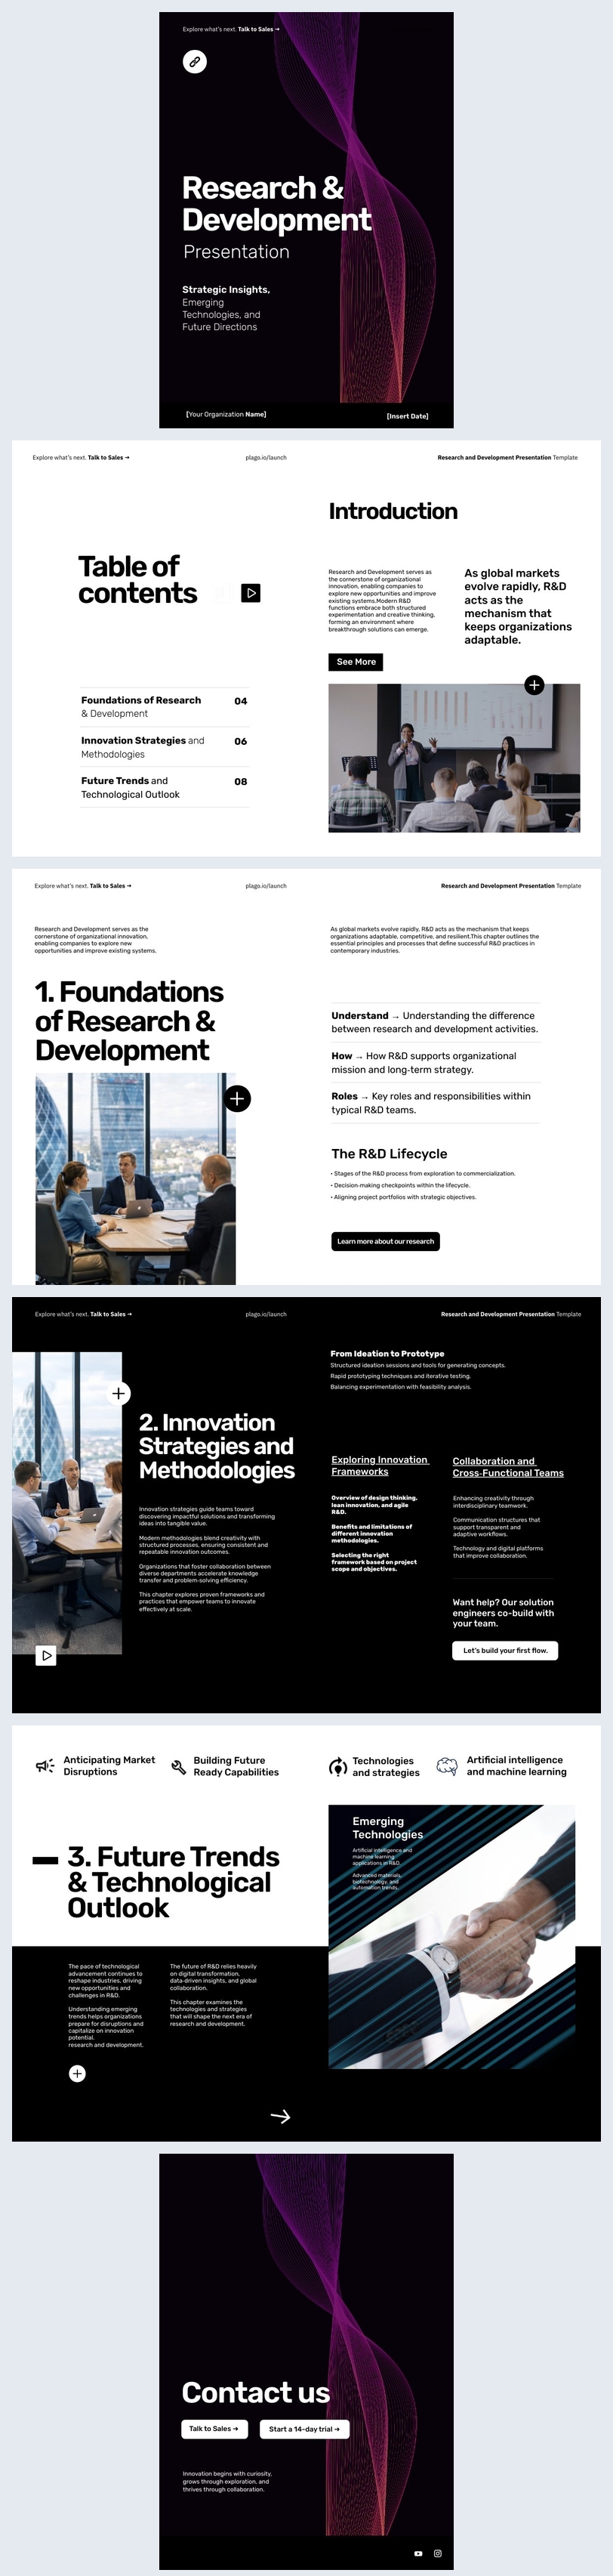
market research report template to use in word
Source: Template.net.
market research report template to print

Source: Template.net.
market research report template to use

Source: Template.net.
market research report template to share with clients

Source: Template.net.
Frequently Asked Questions
What should a market research report template contain?
A practical template should normally provide space for the research objective, scope, methodology, market overview, customer or segment analysis, competitive analysis, findings, recommendations, limitations, sources, and appendices. The exact sections should be adjusted to the decision being supported.
How long should a market research report be?
There is no universal page count. A short decision brief may require only a few pages, while a detailed strategic study can be substantially longer. The right length is the amount required to explain the evidence, reasoning, limitations, and recommendation without unnecessary repetition.
Should I use Word or Excel for market research?
Use Excel or another spreadsheet environment for structured quantitative data, calculations, cross-tabulation, and scenario analysis. Use Word or a similar document editor for the narrative report. Many effective workflows use both rather than forcing one tool to handle every stage.
Can a market research report be created from survey results alone?
It can, but survey data may not answer every business question. Depending on the project, interviews, internal data, competitor research, industry sources, public statistics, or other evidence may provide context that a single survey cannot.
What is the biggest mistake in a market research report?
One of the most damaging mistakes is losing the connection between the research question and the recommendation. A report can contain extensive data and still be unhelpful if the reader cannot determine what the evidence means for the decision.
How should market research findings be presented?
Lead with the conclusion, then provide the evidence supporting it. Use charts and tables where they clarify comparisons or trends, explain important assumptions, and keep detailed technical material available in appendices for readers who need it.
How do I make a report credible?
Make the evidence traceable. Identify sources, explain methodology, distinguish measured facts from derived calculations and estimates, disclose limitations, and avoid stronger conclusions than the evidence supports. Transparency generally does more for credibility than visual polish alone.
Can I create different versions for executives and clients?
Yes. The underlying evidence should remain consistent, but the presentation can change. An executive version may emphasize decisions and recommendations, while a client or analyst version may provide more methodology, supporting tables, assumptions, and detailed findings.
Conclusion
The best market research report template is not simply the most attractive document. It is the structure that helps researchers move logically from a business question to evidence, analysis, interpretation, and action. A useful template makes that chain visible to every important reader.
Choose the working format according to the task. Use spreadsheets for structured analysis and calculations, document editors for narrative reporting, printable layouts for physical review, and digital formats when collaboration or client distribution benefits from them.
Keep the research disciplined by defining scope, documenting methodology, recording assumptions, separating findings from interpretations, and making recommendations specific. Treat government or procurement templates as a separate category when official requirements apply, and always verify current authoritative guidance.
A repeatable workflow also makes future studies easier. When the same organization can reuse its research questions, data dictionaries, analytical conventions, report headings, review checklist, and archiving process, each new study becomes faster without sacrificing analytical quality.
The final document should feel like a decision tool rather than a data archive. Every major section should help answer what was investigated, what the evidence shows, how confident the reader should be, and what should happen next.

Used thoughtfully, a market research report template to build, analyze, and communicate research can turn scattered evidence into a clear business narrative: one that is easier to review, easier to update, easier to share, and ultimately more useful for making informed decisions.
