A report should therefore be treated as a communication system rather than a decorative document. The title, abstract, introduction, methods, results, discussion, conclusion, references, and supplementary material each have a distinct job. When those jobs are separated clearly, readers can find evidence quickly and understand how the reported conclusions follow from the research process.
The most useful template is one that supports that reasoning without forcing inappropriate sections into the project. An experimental laboratory report may emphasize materials, procedures, measurements, uncertainty, and statistical analysis. A field study may require site descriptions and sampling methods. A computational study may need software versions, algorithms, datasets, validation procedures, and reproducibility information.
This article provides a practical framework for making those choices. It also explains how Word and DOCX templates differ from LaTeX and Overleaf templates, how to design a reusable research document, how to handle data and figures, how to avoid common reporting errors, and how to turn a blank template into a completed scientific report efficiently.
What Is a Scientific Report Template?
A scientific report template is a pre-structured document that provides the headings, layout, formatting conventions, and sometimes instructional prompts needed to prepare a research report. It may be as simple as a sequence of headings in a word-processing document or as sophisticated as a LaTeX project containing predefined commands for figures, equations, references, tables, and journal-specific formatting.
The purpose of a template is not to write the scientific content for the researcher. Instead, it provides a stable framework in which that content can be developed. A useful template separates document mechanics from research reasoning: the author decides what the evidence means, while the template provides predictable places for the evidence, analysis, interpretation, and supporting information.
Templates are particularly useful when reports contain recurring components. For example, a laboratory group may repeatedly produce reports containing an abstract, introduction, hypothesis, materials and methods, results, discussion, conclusion, references, and appendices. A reusable structure prevents authors from forgetting routine components and makes reports easier for supervisors or collaborators to review.
There is no universal scientific report format that is correct for every field. Even closely related disciplines may use different conventions for literature reviews, methods, results, discussion, supplementary information, or author contributions. A template should therefore be regarded as a starting framework that must be checked against the actual assignment, institutional instructions, research protocol, journal guidelines, or client requirements.
Before selecting a template, identify the report’s purpose, intended audience, research design, required sections, submission format, citation style, and expected level of technical detail. These decisions matter more than visual styling. A simple document with correct structure is more useful than an attractive template that forces the research into unsuitable headings.
Why Structure Matters in Scientific Reporting
Scientific writing depends on traceability. A reader should be able to determine what question was investigated, why the question mattered, how the investigation was conducted, what was observed, how the observations were analyzed, and what conclusions are justified by the evidence. A template helps make that sequence visible.
Structure also reduces cognitive load. Readers often scan a report before reading it closely, looking at the abstract, headings, tables, figures, conclusion, and references. Consistent headings allow readers to locate the information they need without searching through uninterrupted blocks of prose.
For researchers, structure improves drafting discipline. When a template separates results from discussion, for example, it encourages the author to distinguish between what the data show and what those findings may mean. That distinction is important because interpretation should not quietly become evidence.
For reviewers, consistent organization makes quality control easier. Missing methods, unsupported claims, unexplained variables, incomplete references, or poorly labeled figures become easier to identify when the document has an explicit framework.
For teams, templates establish a shared vocabulary. One researcher can prepare the methods section while another prepares results, provided both understand the same hierarchy, naming conventions, figure rules, and reference system. The final document can then be assembled without extensive structural rewriting.

Core Components of a Scientific Report
Most research-oriented reports can be built from a recognizable group of components, although not every project needs every section. A practical structure begins with the title and author information, followed by an abstract or executive summary where appropriate. The main body commonly includes an introduction, methods, results, discussion, and conclusion.
The title should identify the subject, variables, population, system, intervention, or investigation clearly enough that a reader can understand the report’s focus. Avoid vague titles such as “Experiment Results” when a more descriptive title is possible. A specific title is useful for retrieval, review, archiving, and later reuse of the research.
The abstract provides a compact representation of the project. For many scientific reports, it should communicate the research purpose, essential method, principal findings, and main conclusion. It should not introduce a result that cannot be found in the body of the report, and it should not become a miniature literature review.
The introduction establishes context and explains why the research was undertaken. It should narrow from the broader problem toward the specific research question, objective, hypothesis, or rationale. A good introduction prepares the reader to understand the methods without duplicating them.
The methods section explains how the work was conducted. It should contain enough information for the intended audience to understand the design, materials, participants or samples, procedures, measurements, instruments, controls, analytical techniques, and relevant statistical methods. Reproducibility is more important than decorative detail.

Results, Discussion, and Conclusion
The results section reports the findings in a logical order. It should present observations, measurements, calculated values, statistical outputs, and other evidence without turning every numerical result into a lengthy interpretation. Tables and figures should be introduced in the text and should contribute to the reader’s understanding.
The discussion answers the question, “What do these results mean?” It connects findings to the research question and relevant previous knowledge, considers plausible explanations, addresses unexpected outcomes, and identifies limitations. Strong discussion writing distinguishes between conclusions supported by evidence and possibilities that require further investigation.
The conclusion brings the argument together. It should state the main answer or finding, explain its significance in proportion to the evidence, and address whether the stated objective was achieved. Recommendations may be appropriate when the report has a practical or decision-making purpose.
References provide the evidence trail for ideas, methods, theories, and prior findings that originated outside the report. Every source cited in the text should be represented accurately in the reference list, and every reference should correspond to something actually used. The required citation style should be determined by the relevant instructions rather than chosen solely for appearance.
Appendices are useful for material that supports the report but would interrupt the main narrative if included in full. Depending on the project, this may include raw data, extended calculations, survey instruments, questionnaires, supplementary tables, detailed protocols, or additional figures. Each appendix should be labeled and referenced from the main text when relevant.

How to Choose the Right Template Format
The first format decision is usually whether the report should be created in Microsoft Word, another word processor, or LaTeX. For routine university assignments, internal research documentation, and collaborative office workflows, Word is often convenient because it supports styles, tables, tracked changes, comments, references, and familiar document controls.
A Word template is especially useful when several people need to edit the same file or when a department already uses DOCX as its standard exchange format. A good Word template should use heading styles rather than manually formatted headings, because styles make navigation, table-of-contents generation, and global formatting changes much easier.
LaTeX is particularly valuable for reports containing extensive mathematics, technical notation, complex cross-references, bibliographies, or publication-oriented formatting. Overleaf adds a collaborative web-based environment to the LaTeX workflow. Its template library includes general reports as well as journal-specific templates, but authors still need to verify the current instructions of the destination publication.
The choice should also consider the final deliverable. If the required submission is a DOCX file, building the entire workflow around a PDF-first LaTeX template may create unnecessary conversion work. If the required deliverable is a publication-ready PDF with many equations and references, LaTeX may offer a more controlled workflow.
Accessibility and maintainability matter as well. A reusable template should have readable typography, sensible heading hierarchy, descriptive table and figure labels, consistent spacing, and a logical navigation structure. A template that looks attractive but requires manual page breaks and inconsistent formatting every time it is edited is not a genuinely efficient template.

Word, DOCX, and Overleaf Workflows
Searches for a scientific report template word often reflect a need for a ready-to-edit document rather than a publication template. The key advantage of Word is immediate usability. Authors can replace instructional text, apply styles, insert figures, build tables, and collaborate without learning a markup language.
When evaluating a scientific reports template docx, check whether headings are true Word styles, whether the table of contents can update automatically, whether captions are consistently formatted, and whether the document contains unnecessary formatting artifacts. A clean template should be easier to edit than to rebuild.
A scientific reports template overleaf is a different type of resource. It generally provides source files, document classes, packages, bibliography configuration, and sample structures rather than a conventional word-processing document. Overleaf templates can be excellent for structured scientific writing, but the author must understand how the template compiles and how figures, references, and tables are managed.
For teams, the best format is the one that fits the team’s actual production environment. A laboratory that collects data in spreadsheets and exchanges manuscripts as DOCX may gain little from adopting a complex LaTeX workflow unless there is a clear benefit. Conversely, a research group producing equation-heavy manuscripts for multiple journals may benefit from a reusable LaTeX project.
Regardless of format, keep the research content separate from the template’s cosmetic assumptions. Replace sample text, remove unused sections, confirm all placeholder references are removed, and inspect the final document page by page. Templates accelerate writing only when they are actively adapted to the real project.

How to Build a Scientific Report From Scratch
Start by translating the assignment, research protocol, or project brief into a document outline. Write down the required deliverable, audience, research question, expected evidence, formatting constraints, citation style, word limit, submission file type, and deadline. This planning step prevents the template from dictating the research instead of supporting it.
Next, create the heading hierarchy. A typical scientific report might use Title, Abstract, Introduction, Methods, Results, Discussion, Conclusion, References, and Appendices. Subsections should be introduced only when they improve navigation. Excessive heading depth can make a short report harder to read.
Then configure the document styles. Define the body font, heading levels, line spacing, paragraph spacing, page margins, numbering, figure captions, table captions, and reference formatting. Avoid applying formatting individually to dozens of headings or paragraphs because manual formatting creates inconsistency during later revisions.
Create placeholders for figures and tables before drafting the final prose. This helps reveal where evidence will be presented and can expose gaps in the analysis. A report should not contain a figure merely because the template has a figure placeholder; every visual should answer a communication need.
Finally, save the template as a clean master file before entering project-specific information. The master should contain only reusable structure and legitimate instructional prompts. This prevents future reports from accidentally inheriting old study titles, dates, authors, results, citations, or confidential information.

Step-by-Step Drafting Workflow
One effective workflow is to draft the methods and results before polishing the introduction and abstract. Methods describe what was actually done, while results describe what was actually found. Writing those sections from records and analyzed data helps reduce the risk of making the introduction promise something the study did not ultimately investigate.
After the evidence sections are stable, write the discussion around the research question. Begin with the most important finding, then explain how it relates to the objective, what mechanisms or explanations are plausible, how it compares with relevant prior work, and what limitations affect interpretation.
Write the conclusion after the discussion. The conclusion should not introduce a new analysis, new citation, or unsupported claim. It should answer the central question at the level justified by the data and identify practical or research implications only when they follow logically from the findings.
Write the abstract near the end, even if the template places it at the beginning. This makes it easier to summarize the final study accurately. The abstract should be understandable without requiring the reader to infer missing details from later sections.
Perform formatting and content checks separately. First verify scientific logic, calculations, references, and claims. Then verify headings, spacing, page numbering, captions, table layout, cross-references, and file properties. Separating these review tasks makes it less likely that visual polish will distract from substantive errors.

Designing the Introduction
The introduction should establish a logical funnel. Start with the broader scientific or practical context, then identify the specific problem or uncertainty, summarize the most relevant existing knowledge, identify the gap or motivation, and finish with the research question, objective, hypothesis, or purpose of the report.
Do not turn the introduction into an encyclopedia entry. Include background information because it helps the intended reader understand the investigation. Remove background material that does not contribute to the rationale or interpretation of the study.
Research questions should be specific enough to guide the methods and analysis. If the question concerns a relationship between two variables, the report should make clear what was measured and how the relationship was evaluated. If the study tests an intervention, the introduction should clarify the outcome that determines whether the intervention was useful.
Hypotheses should be stated in terms that can be evaluated with the planned evidence. A vague prediction such as “the treatment will work better” is less useful than a measurable statement defining the expected direction or relationship between specified variables.
A strong introduction creates expectations that the rest of the report fulfills. If the introduction promises an evaluation of reliability, the methods should contain a reliability assessment and the results should report it. This alignment between sections is one of the most valuable functions a template can encourage.

Writing Methods That Support Reproducibility
The methods section should allow an informed reader to understand the research design without guessing how important decisions were made. Begin with the study design, setting, population or material, sampling approach, instruments, procedures, variables, controls, and analysis methods as appropriate for the discipline.
Describe instruments and software when they materially affect the work. For laboratory equipment, relevant model information, measurement ranges, calibration procedures, or operating conditions may matter. For computational research, software versions, packages, parameters, preprocessing steps, and computational environments may be necessary for reproducibility.
Sampling deserves particular attention. State what was sampled, how samples were selected, how many observations were included, and what inclusion or exclusion criteria were applied when relevant. Avoid implying that a convenience sample represents a broader population without an appropriate justification.
Procedures should be written in a sequence that another qualified researcher can follow. Avoid vague phrases such as “the samples were processed normally” when the exact process influences the result. At the same time, do not reproduce routine operating instructions that are irrelevant to the study’s reproducibility.
The analysis plan should identify the logic used to transform observations into reported findings. Explain calculated variables, statistical tests, model assumptions, treatment of missing data, uncertainty estimates, or qualitative coding methods as appropriate. The goal is to make the path from raw evidence to reported result understandable.

Data Collection and Quality Control
Data collection begins before measurements are recorded. Define variables, units, coding conventions, identifiers, acceptable ranges, and recording procedures before gathering the data. A standardized collection sheet can prevent ambiguity and reduce the need to reconstruct decisions later.
Quality control should be proportional to the study. Simple experiments may require instrument checks and duplicate measurements, while larger studies may need validation rules, audit trails, blinded assessment, calibration logs, or independent verification. The report should explain controls that materially affect confidence in the results.
Missing data should not disappear silently. Record how missing observations were identified and, when applicable, whether they were excluded, replaced, modeled, or otherwise handled. The rationale should be stated because different approaches can change the interpretation of results.
Keep original records separate from processed datasets. Raw measurements should be preserved, while cleaned or transformed datasets should have documented changes. This separation supports auditing and makes it possible to reproduce calculations if a question arises about a reported result.
Laboratory notebooks, electronic records, spreadsheets, database exports, and analysis scripts should be organized consistently with the final report. A template cannot guarantee data integrity, but a disciplined document structure can encourage the researcher to record the information needed to explain how the final findings were produced.

Presenting Results Clearly
The results section should answer a simple question: what did the analysis show? Organize findings in the same broad order as the research questions or methods. This allows readers to connect each reported result to the procedure that generated it.
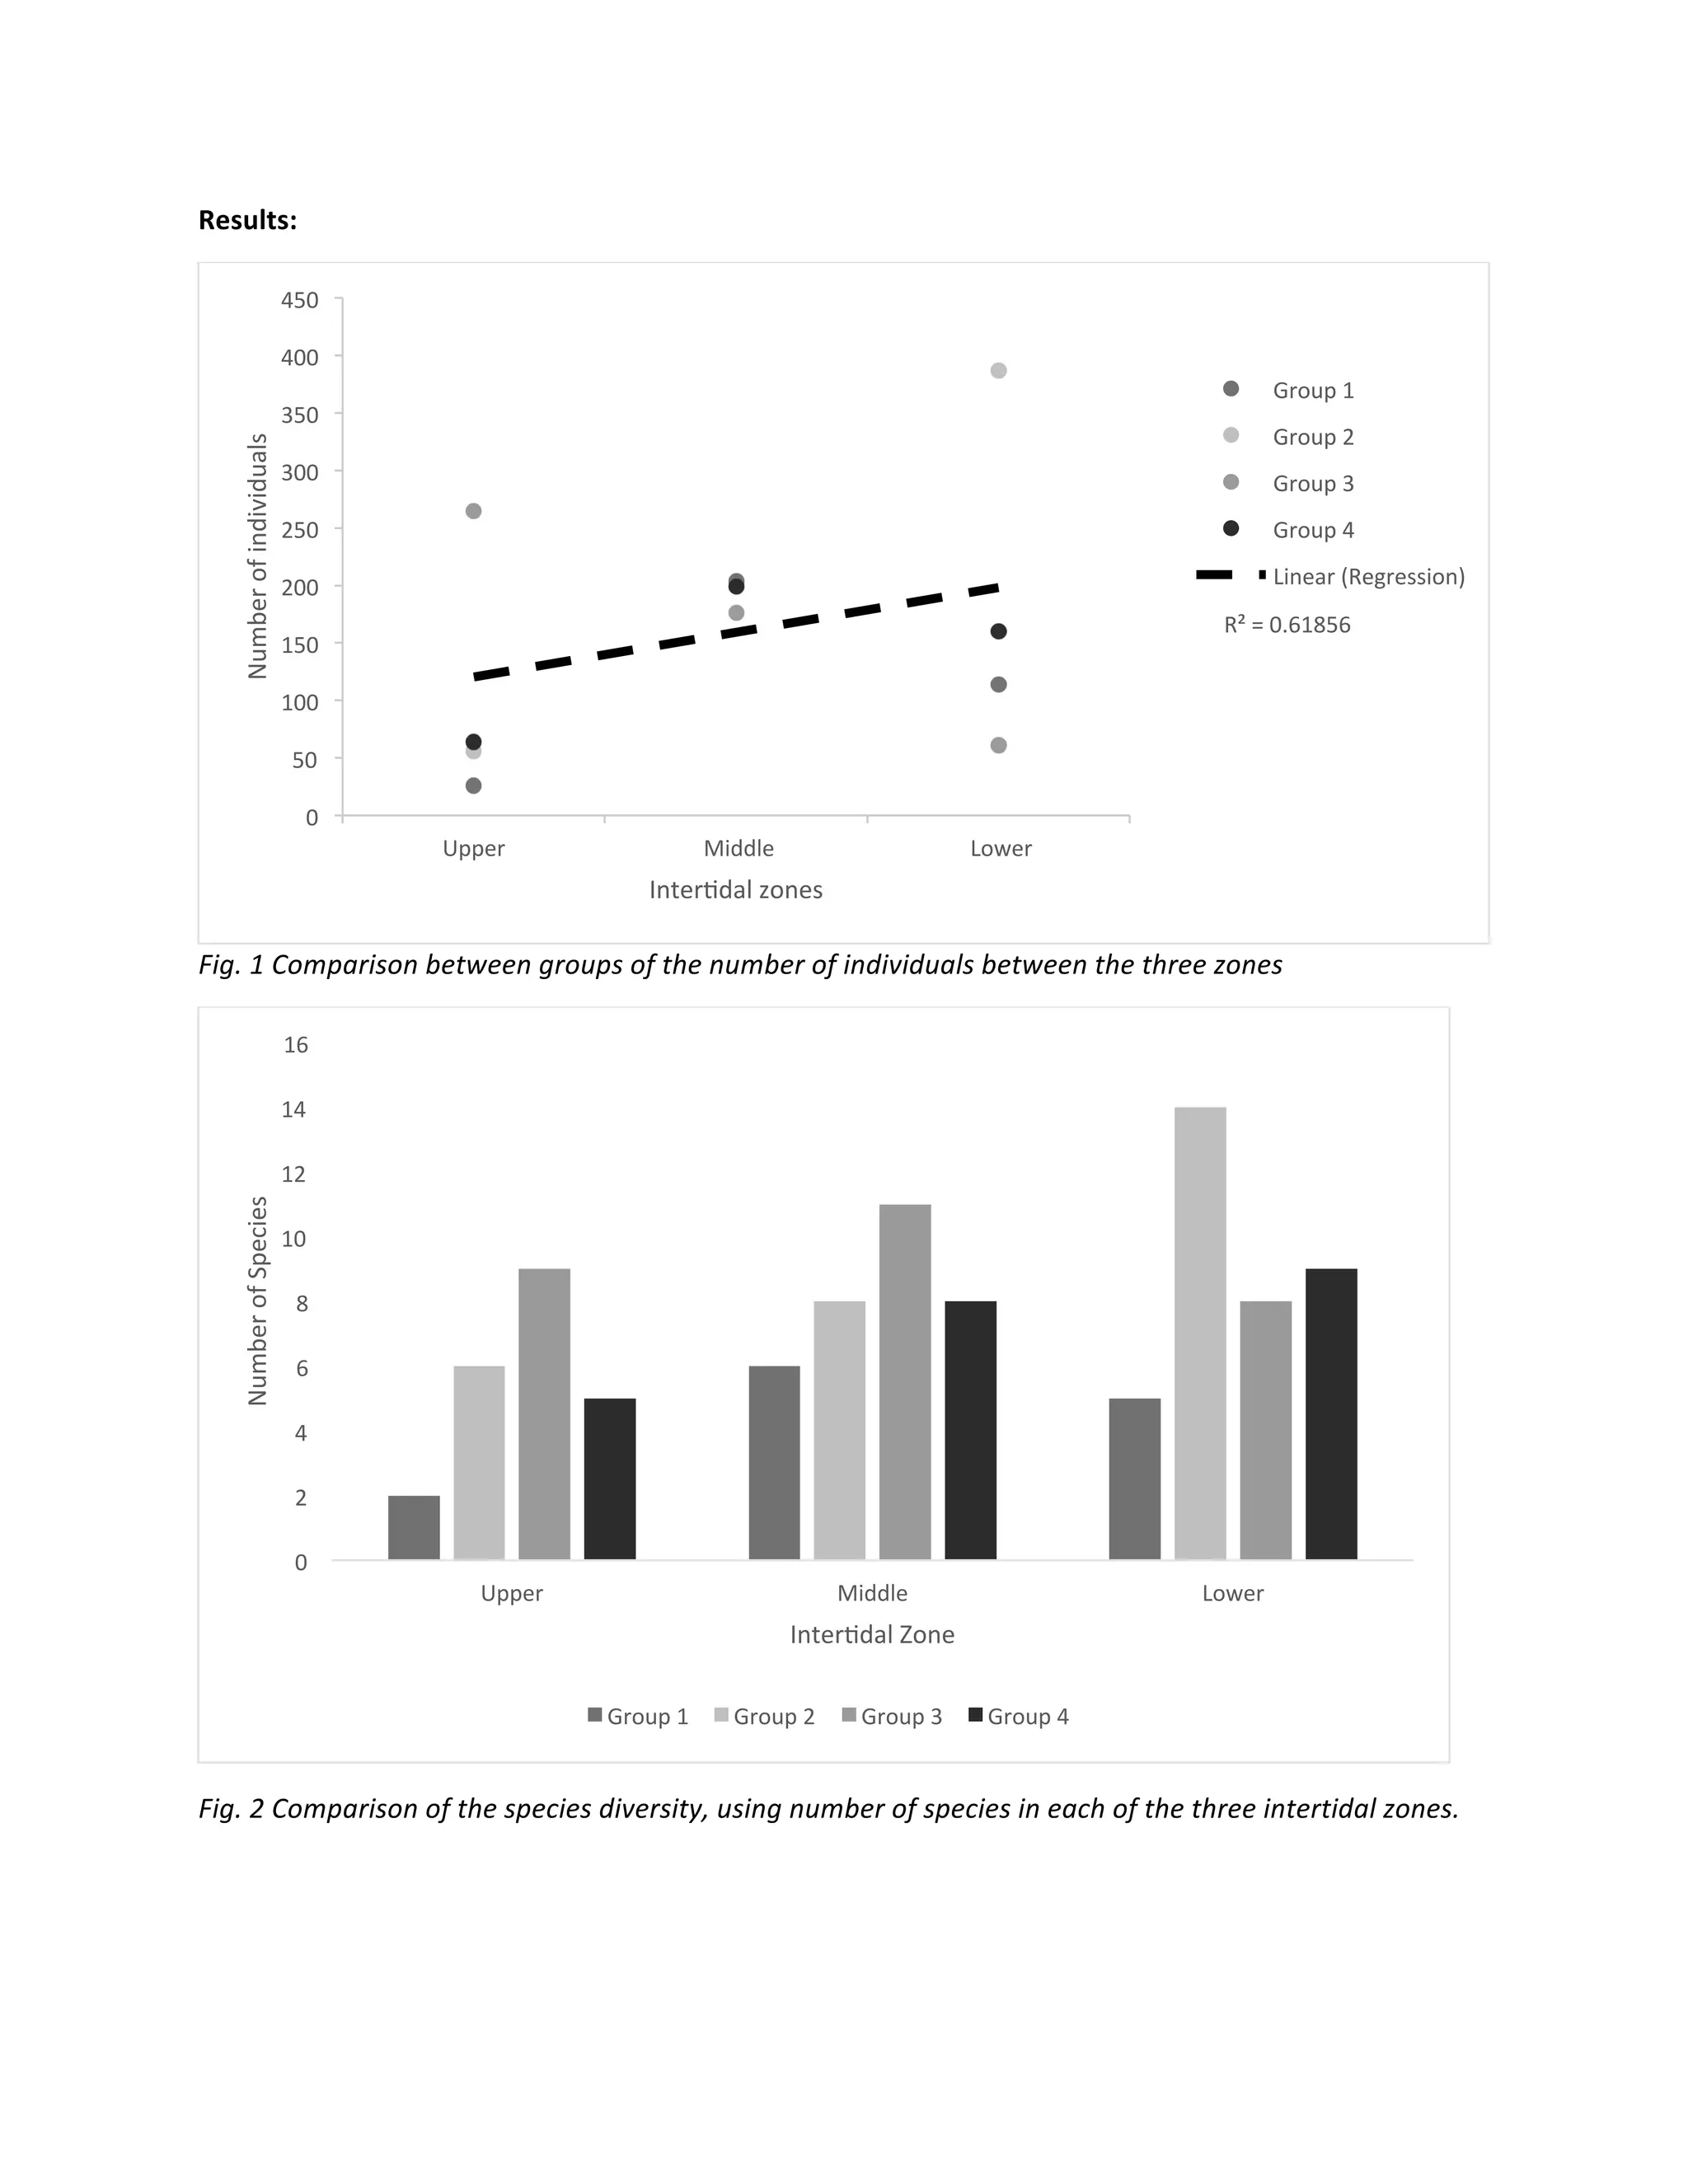
Use tables when readers need exact values, repeated comparisons, or multiple variables. Use graphs when the relationship, trend, distribution, or pattern is more important than individual values. Do not present the same information in a table and graph unless each format provides a distinct communication benefit.
Every figure should have a clear caption and should be referenced in the text. The reader should understand what is plotted, what the axes represent, what units are used, and what symbols or abbreviations mean without having to guess.
Results should distinguish descriptive statements from inferential conclusions. A dataset can show a difference in observed values without necessarily proving that the difference is meaningful beyond the studied sample. Statistical significance, uncertainty, effect size, practical importance, and study limitations should be interpreted carefully.
Avoid decorating graphs with unnecessary effects. Three-dimensional bars, excessive colors, dense legends, unlabeled axes, inconsistent scales, and unexplained abbreviations can make scientific evidence harder to evaluate. The best visual is often the simplest one that communicates the relevant relationship accurately.

Tables, Graphs, and Figures
Tables should have descriptive titles and logically ordered columns. Put units in column headings where possible rather than repeating them in every cell. Align numerical values consistently and use a sensible number of decimal places based on measurement precision.
Graphs should make comparisons easy. Choose axes that represent the variables honestly and avoid truncation that exaggerates small differences unless the purpose and scale are clearly communicated. For scatterplots, include meaningful axis labels and use a fitted line only when the analytical purpose justifies it.
Error bars require explanation. Readers should know whether they represent standard deviation, standard error, confidence intervals, measurement uncertainty, or another quantity. A figure that shows error bars without defining them is incomplete even when the underlying calculation is correct.
Scientific figures should be referenced in numerical order unless the required style specifies another convention. Cross-references should be generated consistently where the software supports them, because manually typed figure numbers are vulnerable to errors when figures are added or removed.
Before submission, inspect figures at the size at which readers will actually see them. A graph that looks clear on a large monitor may become unreadable in a two-column PDF. Check labels, legends, font sizes, resolution, and contrast after the report has been exported to its final format.

Data Analysis and Interpretation
Analysis converts collected observations into evidence that can answer the research question. Depending on the discipline, this may involve descriptive statistics, hypothesis testing, regression, modeling, thematic coding, image analysis, simulation, comparative analysis, or a combination of approaches.
Choose analytical methods based on the research design and data characteristics rather than because a method is popular. Consider measurement level, sample structure, independence, distributional assumptions, repeated observations, missing data, confounding factors, and the question the analysis is intended to answer.
Document transformations. If values are normalized, log-transformed, averaged, filtered, categorized, or otherwise modified before analysis, explain the operation and its rationale. A reader should not have to reverse-engineer a result from unexplained spreadsheet formulas.
When using statistical tests, report the information necessary to understand the analysis. Depending on the context, this may include the test used, sample size, estimate, uncertainty, effect size, confidence interval, or probability value. Avoid presenting a probability value as though it independently measures scientific importance.
Interpretation should remain connected to the study design. An observational association does not automatically establish causation, and a controlled experiment may still have limitations in external validity. The discussion should make those boundaries visible rather than hiding them behind confident language.

Using Statistical Evidence Responsibly
Statistical analysis is most useful when it is integrated with scientific reasoning. Start with the substantive question, identify the quantity that would answer it, and then choose a method appropriate to that quantity. This prevents the common mistake of selecting a statistical test first and searching for a question afterward.
Descriptive statistics can be informative even when no formal hypothesis test is appropriate. Means, medians, ranges, distributions, proportions, and visual summaries may reveal patterns that are central to the research question. They should be reported with enough context to make their interpretation possible.
For comparisons, consider both magnitude and uncertainty. A small numerical difference can be statistically detectable in a large dataset but have little practical significance. Conversely, a potentially important difference may remain uncertain in a small study.
Model-based results require attention to assumptions. If a regression, classification model, or other analytical approach depends on assumptions that are violated, the report should acknowledge the issue and explain any corrective strategy or sensitivity analysis used.
Keep exploratory findings separate from findings that were specified in advance when that distinction matters. Exploratory analysis can generate valuable hypotheses, but it should not be described as though every observed pattern had been predicted before the data were examined.

Writing the Discussion Without Overclaiming
The discussion is where the report demonstrates scientific judgment. Begin with the most important result and relate it directly to the research question. Then consider explanations, relationships to prior evidence, methodological strengths and weaknesses, and the implications that can reasonably be drawn.
Do not repeat the entire results section. Instead, select the findings that matter for interpretation. If a table contains twenty values but only three directly affect the research question, the discussion should focus on those three rather than reproducing every number in prose.
Unexpected findings deserve careful treatment. Possible explanations can be proposed, but they should be labeled as explanations or hypotheses rather than established facts. Consider methodological artifacts, sampling variation, uncontrolled variables, biological or physical mechanisms, and limitations in measurement.
Comparison with previous research should be analytical rather than ceremonial. Explain whether the current findings agree, disagree, extend, or complicate earlier evidence. If results differ, identify plausible reasons such as population differences, methods, measurement conditions, sample size, or study design.
Limitations should be specific. Statements such as “there were some limitations” are not useful. Identify what could affect the result, how serious the issue might be, and whether it changes the confidence that should be placed in the conclusion.

From Findings to Conclusions
A conclusion should answer the research question at the appropriate level of certainty. If the evidence supports a narrow statement, make a narrow statement. Strong scientific writing does not become more persuasive by claiming more than the study can demonstrate.
Recommendations are appropriate when the report has a decision-making purpose or when the evidence clearly suggests a next action. Recommendations should be connected to findings and should identify relevant conditions, risks, or limitations.
Future research can be discussed when a meaningful unanswered question emerges from the work. Avoid adding generic statements such as “more research is needed” unless the report can identify what research should be done and why it would reduce a particular uncertainty.
A conclusion can also address whether the original objective was achieved. If only part of the objective was achieved, say so. This is more useful than rewriting the objective as though the investigation produced a complete answer.
When the conclusion is concise and evidence-based, it becomes one of the most valuable sections for readers who need to understand the outcome quickly. A good template gives the conclusion enough visual prominence to be found easily without making it visually disproportionate to the rest of the report.

References, Citations, and Research Integrity
A scientific report should make clear which ideas, methods, data, quotations, and findings come from other sources. Citations are therefore part of the evidence structure rather than merely a formatting requirement. They allow readers to trace claims back to the literature and evaluate the basis for the report’s reasoning.
Use the citation style required by the assignment, journal, organization, or discipline. Do not mix conventions casually. A reference manager can help maintain consistency, but automated citation tools still require human checking because imported metadata can contain incorrect titles, authors, dates, page numbers, or publication details.
Primary research articles may be particularly important when supporting claims about experimental findings. Review articles can help establish broader context, while authoritative standards, datasets, manuals, or institutional documents may be appropriate for methods and technical requirements. Choose sources based on relevance and credibility rather than citation count alone.
Keep a research source record while writing. Saving the full bibliographic details when a source is first used is much safer than trying to reconstruct the reference list at the end. For online resources, record the information required by the applicable citation style and verify the source before submission.
Research integrity also means preserving the distinction between source evidence and the author’s own interpretation. Paraphrasing should genuinely restate an idea in original language while retaining its meaning, and source attribution should remain clear. A template cannot replace responsible scholarship, but it can provide a consistent place for citations and references.
Practical Examples of Template Use
Consider a hypothetical biology experiment comparing two growth conditions. The template might begin with a concise title, an abstract, an introduction explaining the biological question, methods describing the growth conditions and measurement procedure, results containing a table and graph, a discussion of the observed differences, and a conclusion addressing the hypothesis.
For a market research project, the same broad logic can be adapted without pretending it is a laboratory report. The introduction can define the business problem, methodology can describe sampling and survey design, results can summarize responses, discussion can interpret patterns and limitations, and recommendations can translate findings into decisions.
A field ecology report may need a site description, sampling design, environmental conditions, species observations, statistical analysis, maps, photographs, and appendices containing detailed field records. The template should be expanded to support those needs rather than forcing everything into generic laboratory headings.
A computational research report may emphasize dataset preparation, algorithm selection, computational environment, evaluation metrics, validation procedures, error analysis, and reproducibility information. In this case, a template that includes a large materials section but no place for software configuration may be a poor fit.
These examples illustrate an important principle: the reusable element is the reporting logic, not necessarily the exact heading names. Start from the purpose and evidence of the project, then adapt the template so that each section has a meaningful job.

Common Scientific Report Template Mistakes
One common mistake is treating a template as an official requirement when it is only an example. A template found online may be useful, but it does not automatically reflect the rules of a university, journal, laboratory, funding agency, or employer. Always compare it with the actual instructions governing the submission.
Another mistake is leaving sample text in the final document. Placeholder names, example references, instructional comments, sample values, and demonstration figures can survive unnoticed when authors focus on the main text. A final placeholder audit should search the entire document, including headers, footers, captions, tables, footnotes, and appendices.
Over-formatting is another problem. Excessive colors, decorative borders, large title blocks, complex page designs, and inconsistent typography can make a scientific report look more like a brochure than a research document. Visual hierarchy should help readers navigate evidence rather than compete with it.
Templates can also encourage section filling instead of scientific reasoning. Authors sometimes add unnecessary subsections simply because the template contains them. If a section has no meaningful content for the project, remove it or confirm that the relevant instructions require it.
Finally, avoid assuming that a polished template makes weak evidence persuasive. Formatting cannot compensate for an unclear research question, inadequate sampling, unexplained analysis, unsupported claims, missing references, or poor data quality. The template is an organizational tool, not a substitute for research quality.

Practical Solution: Build a Reusable Scientific Report System
The most practical solution is to create a master template that reflects the recurring needs of your actual research environment. Start with the required report structure, then build styles for titles, headings, body text, captions, tables, equations, references, and appendices. Save this clean master separately from individual project reports.
Next, create a project checklist alongside the template. The checklist should cover research question, objectives, methods, data quality, analysis, figures, references, appendices, formatting, file naming, and submission requirements. This turns the template into a repeatable workflow instead of merely a document design.
For a Word workflow, use built-in heading styles, automatic page numbers, automatic table of contents generation, caption tools, cross-references, and tracked changes where appropriate. Store recurring boilerplate separately from project-specific text so that outdated material is not accidentally carried into a new report.
For an Overleaf workflow, maintain a clean project structure with a main source file, separate figure directory, bibliography file, and clearly named supporting files. Document any packages or custom commands that the team needs. When a journal-specific template is used, preserve the publisher’s required structure rather than modifying it for cosmetic reasons.
Before adopting any template as a standard, test it with a realistic report. Insert several headings, a long table, multiple figures, equations, citations, an appendix, and enough text to create page breaks. Export the document to the final delivery format and inspect it carefully. A template is ready for repeated use only after it survives a realistic test.
Scientific Report Template Word: A Practical Setup
If the intended workflow is Microsoft Word, begin with a blank document and configure the page size and margins according to the governing instructions. Then define the Normal style and heading styles before entering report content. This ensures that later global changes can be made without manually editing every paragraph.
Create a title-page structure that contains only information actually required by the project. Common fields can include report title, author, affiliation, course or department, supervisor, project identifier, and date, but these should never be added automatically as though every institution requires them.
Set up captions before inserting figures. Consistent caption styles make it easier to generate lists of figures and keep labels uniform. The same principle applies to tables. If a report contains many tables, establish a consistent numbering and title system from the beginning.
Use navigation tools while drafting. A structured Word document should allow the author to jump between sections, collapse headings, reorganize material, and update the table of contents without manually changing page numbers. These features become especially valuable as a report grows.
For anyone searching for a scientific report template word free download, the important question is not simply whether a file costs nothing. Check the file’s licensing, editability, compatibility, structure, and source. A free file with broken styles or unclear licensing may create more work than a simple template built internally.
Scientific Report Template to Use in Research Projects
A scientific report template to use in research should begin with the research workflow rather than with a visual theme. Identify what information must be captured at each stage of the study, from research planning through data collection, analysis, interpretation, and final communication.
During planning, the template can provide fields for the research question, objectives, hypotheses, variables, study design, sampling strategy, and planned analysis. These fields create a bridge between the research protocol and the eventual report, reducing the risk that important design decisions disappear from the final documentation.
During data collection, supporting records should remain sufficiently detailed to reconstruct the study. The final report does not need to contain every operational note, but it should explain the methods and quality controls that are relevant to interpreting the results.
During analysis, preserve a clear relationship between source data, transformations, calculations, models, and reported findings. The report should state the analytical logic, while detailed code, raw datasets, or extended calculations can be placed in appropriate repositories or appendices when permitted.
During reporting, use the template to maintain consistent terminology. A variable should not be called one name in the methods, another in a figure, and a third in the discussion unless the differences are intentional and explained. Consistency improves both scientific precision and searchability within the document.
Scientific Reports Template Download and Selection Criteria
When comparing a scientific reports template download with another option, inspect the actual document rather than choosing based on its thumbnail. Look for editable headings, clean paragraph styles, sensible spacing, clear placeholders, compatible file formats, and a structure that matches the type of report being produced.
A scientific reports template word download can be convenient for teams that already use Microsoft Word, but verify whether the file is genuinely editable and whether it contains hidden or unnecessary formatting. Open the style pane, inspect headings, and test whether changing a heading style updates all corresponding headings.
A scientific report template to download should also be evaluated for licensing and provenance. If a resource is offered by a university, publisher, professional organization, or recognized repository, its purpose and context may be easier to establish. Commercial template sites can also provide useful examples, but users should distinguish between a visual template and an authoritative reporting requirement.
A scientific report template to use in word should be tested with the exact version of Word and the output format required by the submission process. Fonts can substitute unexpectedly, tables can move across pages, and figures can change size after conversion. Testing avoids discovering these problems on the submission deadline.
The same principle applies to a scientific report template to use in research. A template should reduce repeated work, preserve essential information, and support review. If it creates more manual editing than it eliminates, simplify it. The best research template is usually the one that disappears into the workflow and lets the evidence remain the focus.
Reference Examples
The examples below illustrate different visual approaches to scientific and research reporting. They are examples of document presentation and structure, not universal institutional requirements. Always confirm the current requirements of the organization or publication receiving your report.
scientific report template word
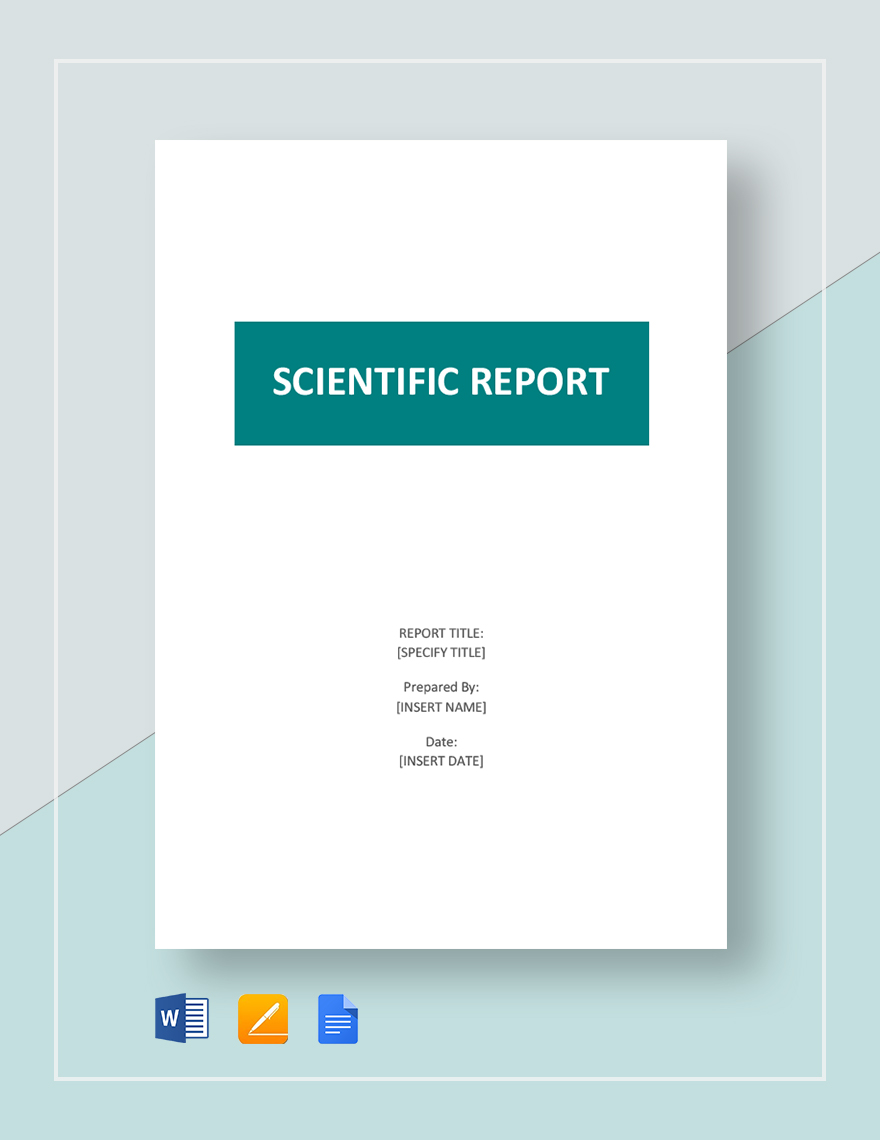
Source: Template.net
scientific report template word free download

Source: Documentof
scientific report template

Source: Documentof
scientific reports template overleaf

Source: Documentof
scientific reports template docx

Source: Documentof
scientific reports template download

Source: Documentof
scientific reports template word download

Source: Documentof
scientific report template to download

Source: Documentof
scientific report template to use in word

Source: Documentof
scientific report template to use in research
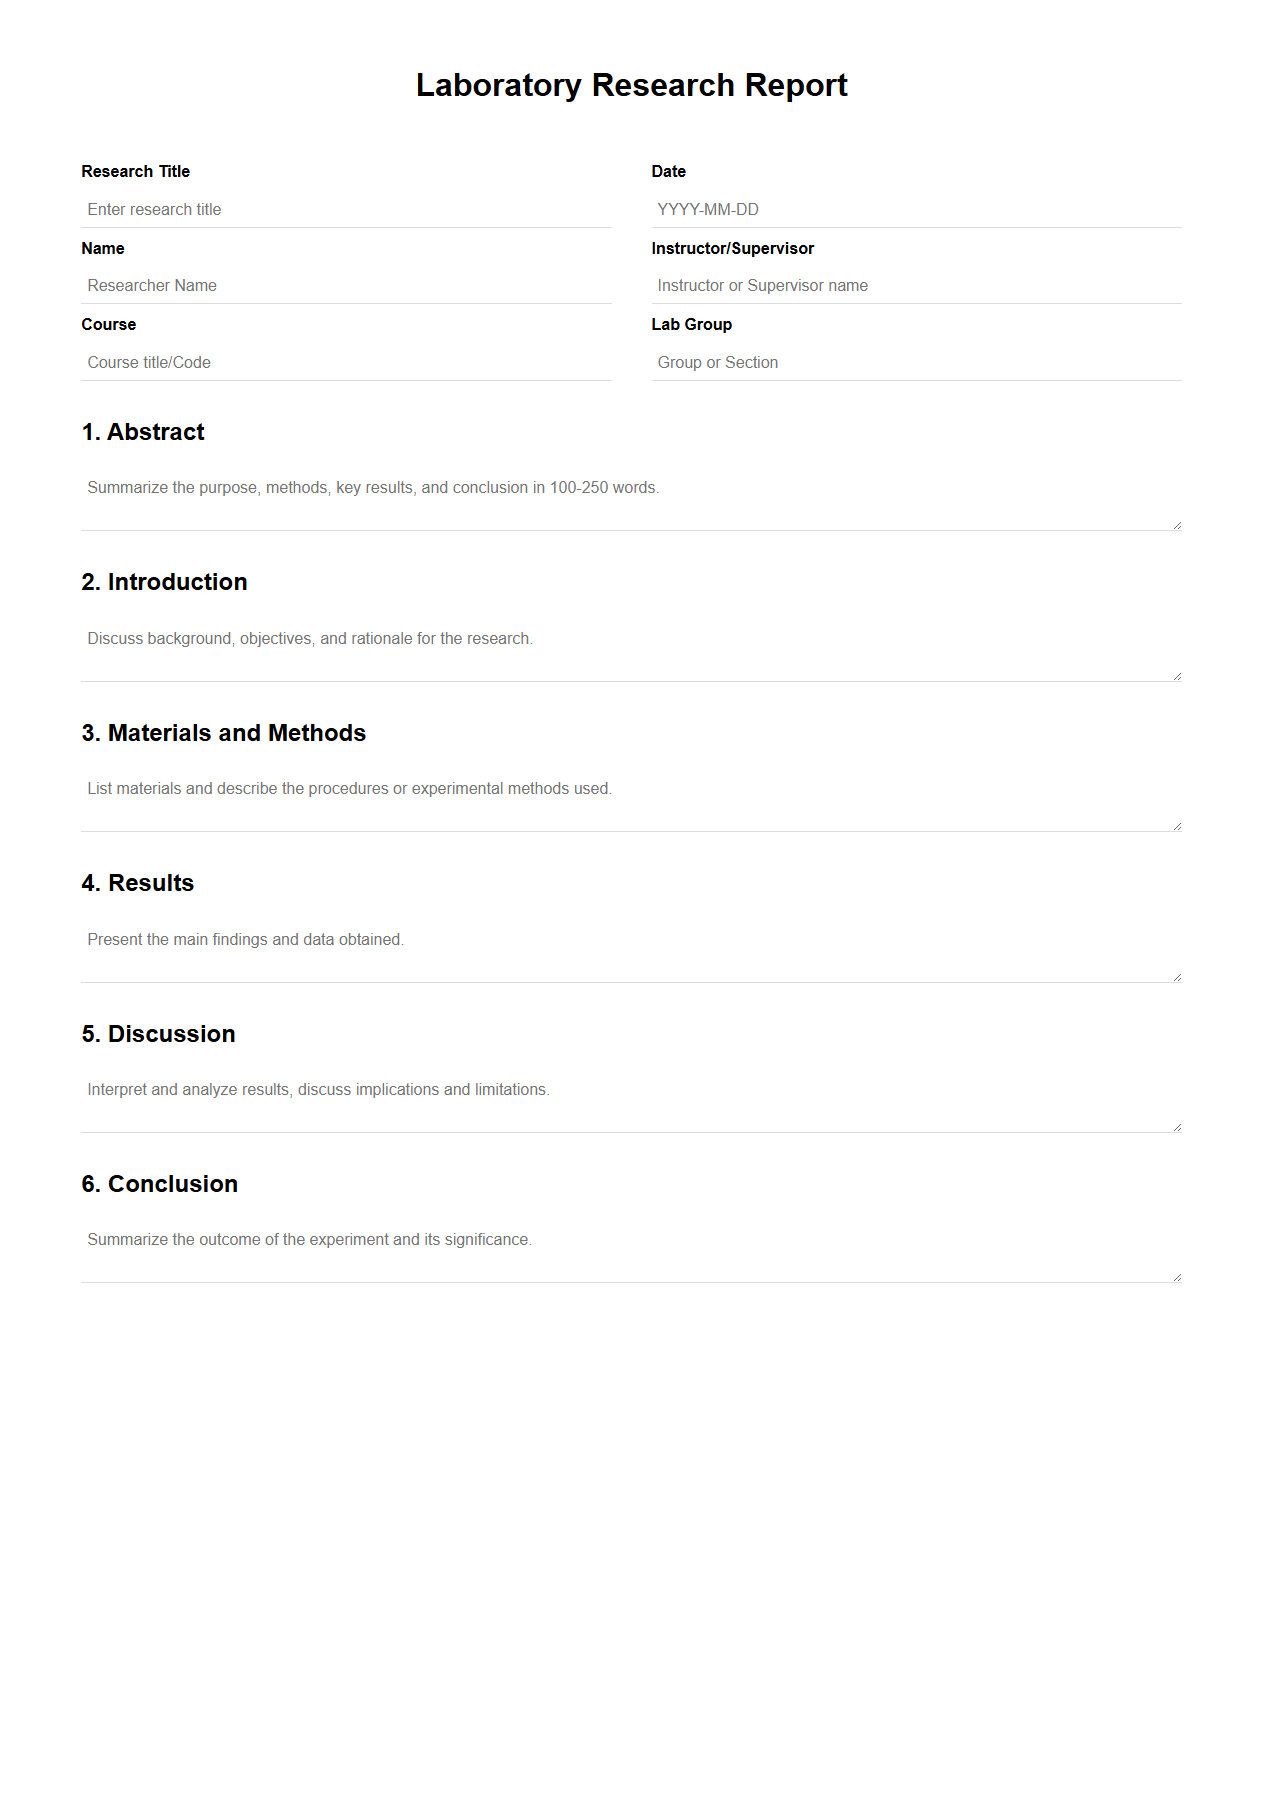
Source: Documentof
Frequently Asked Questions
What is the best scientific report template to start with?
The best starting point is the simplest template that matches the report’s required structure and file format. For a university laboratory assignment, that may be a Word document with standard scientific sections. For a publication manuscript, the journal’s current template may be more appropriate. The important factor is compatibility with the actual reporting requirements.
Can I use a Word template for a scientific research report?
Yes. Word is suitable for many scientific reports, particularly where collaboration, tracked changes, comments, tables, and DOCX submission are important. Use heading styles, consistent captions, automatic numbering, and reference-management tools rather than relying on manual formatting.
Is an Overleaf template better than a Word template?
Neither is universally better. Overleaf and LaTeX can be advantageous for equation-heavy, publication-oriented, or highly structured documents. Word may be more convenient for teams and assignments that require DOCX. Choose based on the project’s technical and submission requirements.
What sections should a scientific report contain?
A common structure includes a title, abstract, introduction, methods, results, discussion, conclusion, references, and appendices where needed. Some reports also include a literature review, recommendations, acknowledgements, data availability statement, or supplementary information. The required structure depends on the discipline and purpose.
Should the introduction and literature review be separate?
Not necessarily. Some disciplines combine the literature review with the introduction, while others require a separate literature review. Follow the governing instructions. The key goal is to establish what is known, what remains uncertain, why the study matters, and how the present research addresses that need.
How long should a scientific report be?
There is no universal length. A short laboratory report may be only a few pages, while a thesis, technical study, or extensive research report may be much longer. Follow the applicable word or page limit and prioritize evidence, reasoning, and clarity over reaching an arbitrary length.
What makes a scientific report template useful?
A useful template reduces repetitive formatting work, provides a logical information hierarchy, supports consistent figures and tables, makes navigation easier, and helps authors remember required components. It should be easy to adapt and should not force unrelated research projects into the same rigid structure.
Should raw data be included in the main report?
Usually, the main report should contain the data needed to support the argument in an understandable form. Large raw datasets may be provided separately, in an appendix, or through an appropriate repository when permitted. The report should explain how the data were collected, processed, analyzed, and represented.
How can I check a scientific report before submission?
Use separate content and formatting checks. Confirm that the research question, methods, results, discussion, conclusion, calculations, figures, tables, and references are internally consistent. Then inspect page breaks, headings, captions, numbering, citations, appendices, file format, and submission requirements. A final read from the perspective of an unfamiliar reader can reveal missing explanations.
Conclusion
A scientific report template to build a strong report should do more than provide attractive pages. It should create a reliable framework for communicating a research question, documenting methods, presenting evidence, interpreting findings, and reaching conclusions that match the strength of the data. The structure should serve the science rather than the other way around.
Whether you choose Word, DOCX, Overleaf, LaTeX, or another format, begin with the actual requirements of the project. Define the audience, purpose, research design, required sections, citation style, figures, tables, appendices, and final file format before committing to a template. Then adapt the template rather than allowing an online example to dictate the content.
A reusable template becomes especially valuable when it is connected to a repeatable research workflow. Standardized headings, styles, captions, data records, analysis documentation, reference management, and quality-control checks can reduce avoidable errors across multiple projects. The result is not merely a cleaner document but a more traceable and maintainable record of research.
The strongest reports also preserve a clear boundary between evidence and interpretation. Methods explain how evidence was produced, results show what the analysis found, discussion explains what those findings may mean, and conclusions state what can reasonably be claimed. A well-built template makes those distinctions visible and therefore easier for both writers and readers to follow.
Ultimately, the right scientific report template is the one that makes accurate reporting easier, supports reproducibility, improves navigation, and leaves the researcher more time to think about the substance of the work. Treat the template as a flexible research tool, verify every requirement against the authoritative instructions for the project, and refine the structure whenever experience shows that a different organization communicates the science more effectively.
