Current examples of market research reporting commonly place the executive summary, objectives, methodology, market overview, customer or target-market analysis, competitive analysis, findings, recommendations, and supporting material into a structured report. :contentReference[oaicite:0]{index=0}
This guide explains how to build and use a market research report template across common formats, including Word, PDF, Excel, Google Docs, and Google Sheets. It also explains when a free template is sufficient, when a specialized format is better, and how to avoid turning a template into a rigid document that does not fit the research question.
The central principle is simple: format the report around the decision the research must support. A pricing study, customer satisfaction study, new-market assessment, competitive study, product concept test, and government acquisition study may all require different evidence even though their reports share a common backbone.

What Is a Market Research Report Template?
A market research report template is a predefined framework for documenting research findings. It provides spaces or sections for the information that decision-makers normally need, while leaving the actual evidence, interpretation, and recommendations to the research team.
The template should distinguish between information that describes the study and information that answers the business question. For example, the methodology may explain how respondents were selected, while the findings explain what those respondents revealed. Recommendations then connect those findings to action.
A good structure also protects the reader from a common reporting problem: receiving a large collection of charts without an explanation of what matters. The report should make the meaning of the evidence obvious without forcing executives or stakeholders to reconstruct the argument themselves.
Research reporting guidance commonly treats the executive summary as a high-value part of the document, while detailed methodology, supporting data, questionnaires, and additional evidence can be retained in later sections or appendices. :contentReference[oaicite:1]{index=1}
Templates therefore work best as decision-support systems rather than decorative layouts. If a section does not contribute to the research question, explain an important limitation, preserve necessary evidence, or support a recommendation, it may not belong in the final version.

Why Use a Market Research Report Template?
Consistency is one of the biggest advantages. When teams use a common structure, readers learn where to find objectives, methodology, findings, and recommendations. That makes reports easier to compare across projects and reduces the time spent deciding how every new report should be organized.
A template also reduces formatting work. Researchers can spend more time validating sources, cleaning data, checking calculations, interpreting evidence, and challenging assumptions instead of repeatedly rebuilding title pages, section headings, tables, and standard report components.
Another benefit is completeness. A carefully designed template reminds researchers to document information that is easy to overlook, such as the research period, sample definition, data sources, limitations, assumptions, analytical methods, and relationship between findings and recommendations.
Consistency does not mean every project needs the same number of pages. A small customer survey might need a concise report, while a major market-entry study could require detailed market sizing, segmentation, competitor research, customer interviews, scenario analysis, and extensive appendices.
The strongest approach is to create a core framework and then scale it. Keep the decision, objectives, methodology, findings, implications, recommendations, and evidence structure consistent while adding or removing sections according to the complexity of the project.

Core Sections of a Market Research Report Template
A practical template usually begins with the report title and project information. Include the research topic, organization, project owner, audience, research period, report date, and version number where those details matter for document control.
The executive summary should state the purpose of the research, the most important findings, their implications, and the recommended actions. Although it appears near the beginning, it is usually easier to write after the full analysis is complete.
The objectives section should define the business questions the research was designed to answer. Strong objectives are specific enough to determine what information must be collected and what kind of recommendation the final report should produce.
The methodology section describes how evidence was gathered and analyzed. Depending on the study, this may include surveys, interviews, focus groups, observational research, secondary research, competitive intelligence, internal analytics, sampling procedures, data-cleaning methods, and analytical techniques.
The findings section should organize evidence by meaningful themes rather than simply reproducing every questionnaire item in numerical order. Recommendations then translate the most important findings into actions, while appendices provide detailed supporting material for readers who need to examine the evidence more closely.
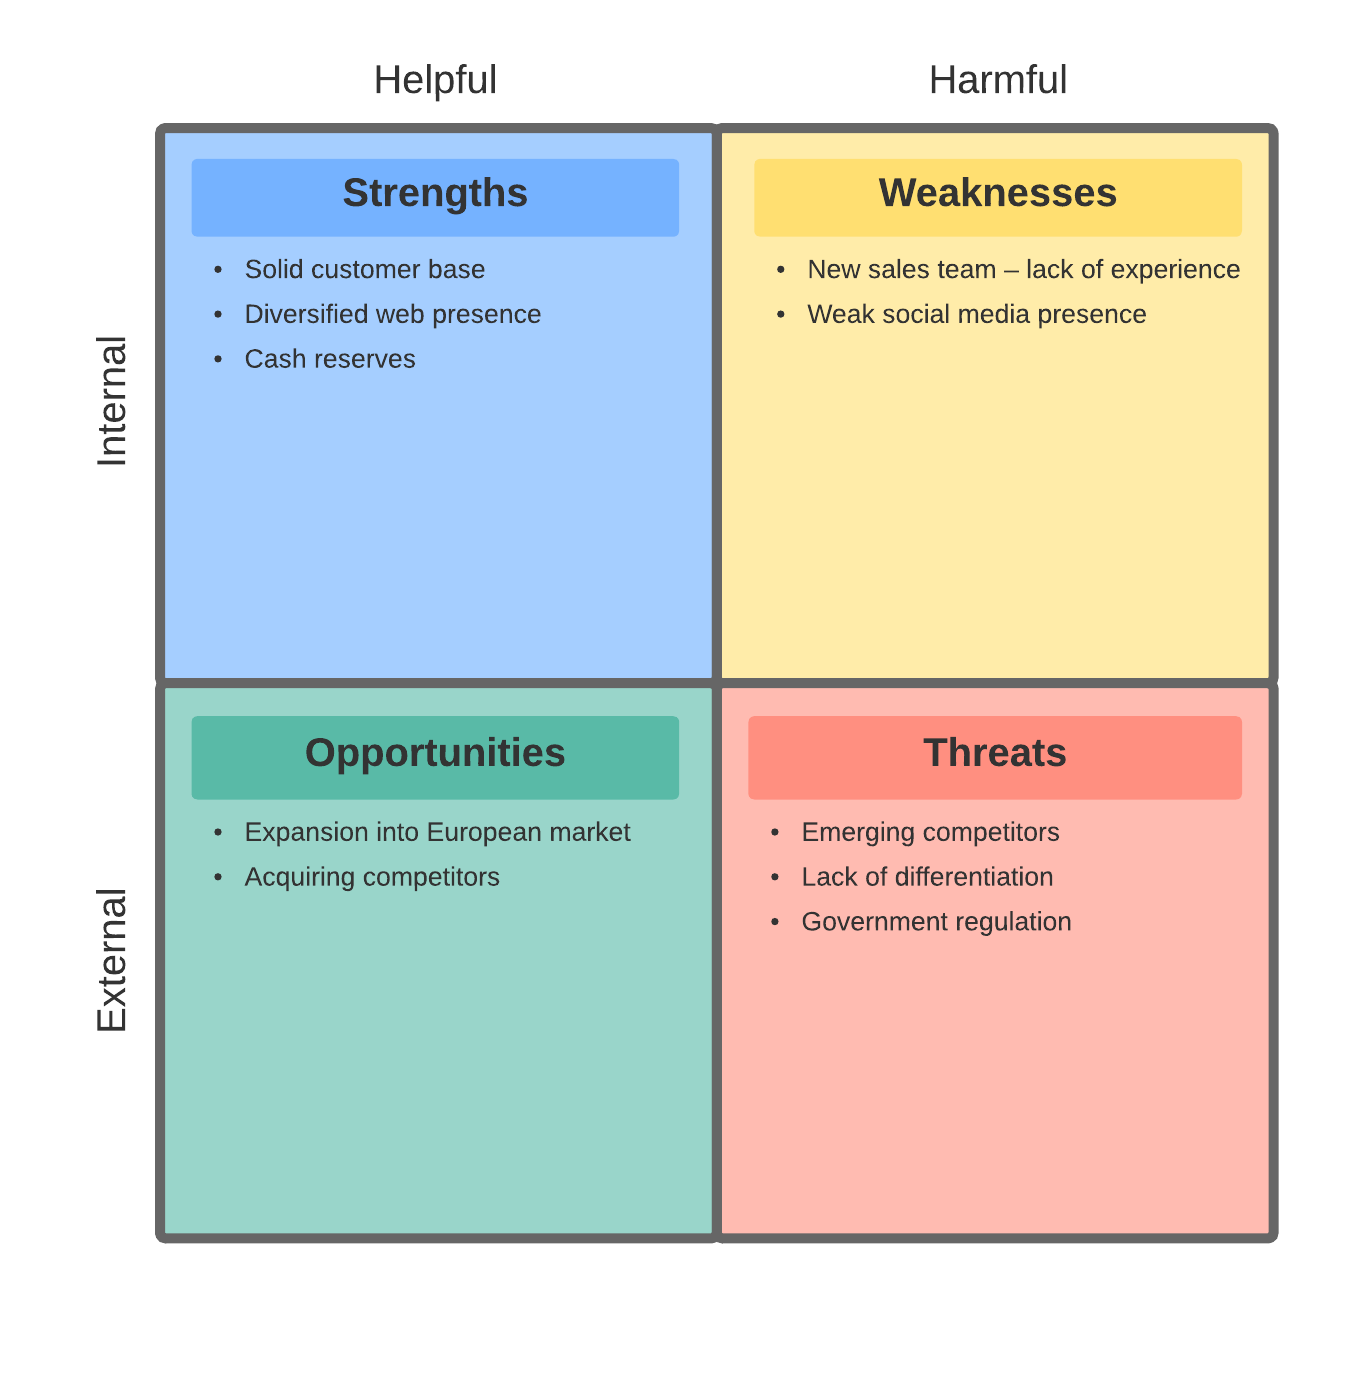
1. Executive Summary
The executive summary is the report’s decision layer. A senior reader should be able to understand the research purpose, the strongest findings, the most important implications, and the recommended next steps without reading every page.
Keep the summary evidence-led. Instead of saying that the market is “promising,” identify the evidence that makes it promising, such as a particular unmet need, a customer preference, a competitive gap, a viable price range, or a clearly defined segment.
Do not introduce findings in the executive summary that are unsupported elsewhere in the report. Every major statement should be traceable to the analysis, a documented source, or an explicitly identified assumption.
A useful structure is a short objective statement, a methodology snapshot, three to five major findings, a concise interpretation of what those findings mean, and a small number of prioritized recommendations.
Write the executive summary last. Doing so reduces the risk of promising a conclusion before the analysis has been completed and allows the summary to reflect the final evidence rather than the research team’s initial expectations.

2. Research Objectives and Business Questions
The objective is the anchor of the entire report. If the objective is vague, the questionnaire can become unfocused, the analysis can become bloated, and the final recommendations can become difficult to defend.
Good objectives use decision-oriented language. Examples include determining whether a target segment has sufficient demand, understanding why customers switch suppliers, testing perceptions of a proposed product, evaluating price sensitivity, or assessing whether a market-entry opportunity warrants further investment.
Separate the primary business question from secondary questions. The primary question should represent the decision that matters most. Secondary questions should provide evidence needed to answer it rather than becoming independent research projects.
Before collecting data, map each important question to the section where its answer will appear. This question-to-section approach helps prevent unnecessary survey questions and makes the eventual report more coherent. :contentReference[oaicite:2]{index=2}
For example, if the final report will recommend a price, the research design should collect evidence capable of supporting that recommendation. If the report will recommend a target segment, the study needs variables that distinguish segments meaningfully rather than merely collecting demographic information for its own sake.

3. Research Methodology
The methodology section tells readers how the evidence was produced. It should be detailed enough for stakeholders to understand the study’s credibility without becoming a technical diary of every operational step.
For quantitative research, describe the survey instrument, target population, sampling approach, field period, response volume, screening criteria, and relevant analytical procedures. If the sample is not representative of the broader market, state that limitation clearly.
For qualitative research, document the participant profile, recruitment approach, interview or discussion format, research objectives, coding or thematic-analysis approach, and the basis on which themes were identified.
Secondary research should identify the categories of sources used and explain how conflicting estimates, different definitions, publication dates, and methodological differences were handled. A market size number without a clear definition can be misleading even when the arithmetic is correct.
The methodology should also document important limitations. Sampling constraints, missing data, small subgroups, self-reported behavior, potential response bias, outdated secondary sources, and differences between stated intent and actual behavior can all affect how findings should be interpreted.

4. Primary and Secondary Research
Primary research is information collected specifically for the current research objective. Surveys, customer interviews, focus groups, usability sessions, observational studies, and experiments can all provide primary evidence.
Secondary research uses information that already exists, such as public statistics, regulatory material, industry reports, competitor information, company filings, academic research, trade publications, and internal historical data.
The two approaches answer different needs. Primary research can reveal customer attitudes, preferences, motivations, and reactions that are not available elsewhere. Secondary research provides market context, historical information, industry structure, and evidence beyond the reach of a small proprietary sample.
A strong report makes the distinction visible. Readers should be able to tell whether a statement came from respondents, internal operational data, a public source, a competitor observation, or the researcher’s interpretation.
Combining methods can also improve confidence. When several independent sources point toward the same conclusion, the finding is generally more persuasive than a conclusion supported by one narrow evidence stream.
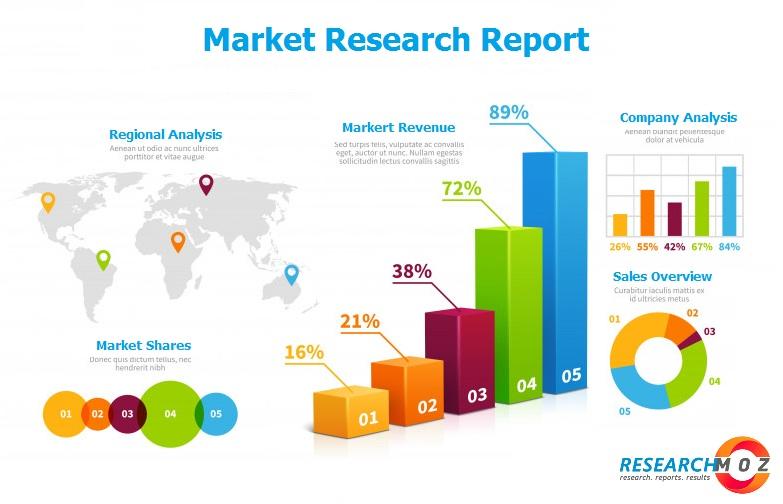
5. Market Overview and Market Sizing
The market overview provides the context needed to interpret customer and competitive findings. It can cover category definitions, market boundaries, geographic scope, demand drivers, major trends, relevant channels, regulatory influences, and the competitive structure.
Market sizing should be explicit about definitions. Terms such as total addressable market, serviceable available market, and obtainable market are useful only when the report explains how each number was calculated and what assumptions distinguish one from another.
For example, a hypothetical software company might define its total market as all organizations that could theoretically use its category of software. Its serviceable market might narrow that group by geography, company size, and technical requirements. Its obtainable market would then represent a realistic portion that could be reached under the planned strategy.
A template should provide fields for the market definition, source, date, geographic scope, calculation method, assumptions, and confidence level. This prevents a single headline number from being presented without enough context to evaluate it.
Market sizing should also avoid false precision. If the underlying sources are estimates or the boundaries of the category are uncertain, a range or scenario-based estimate can be more honest than an exact-looking figure.
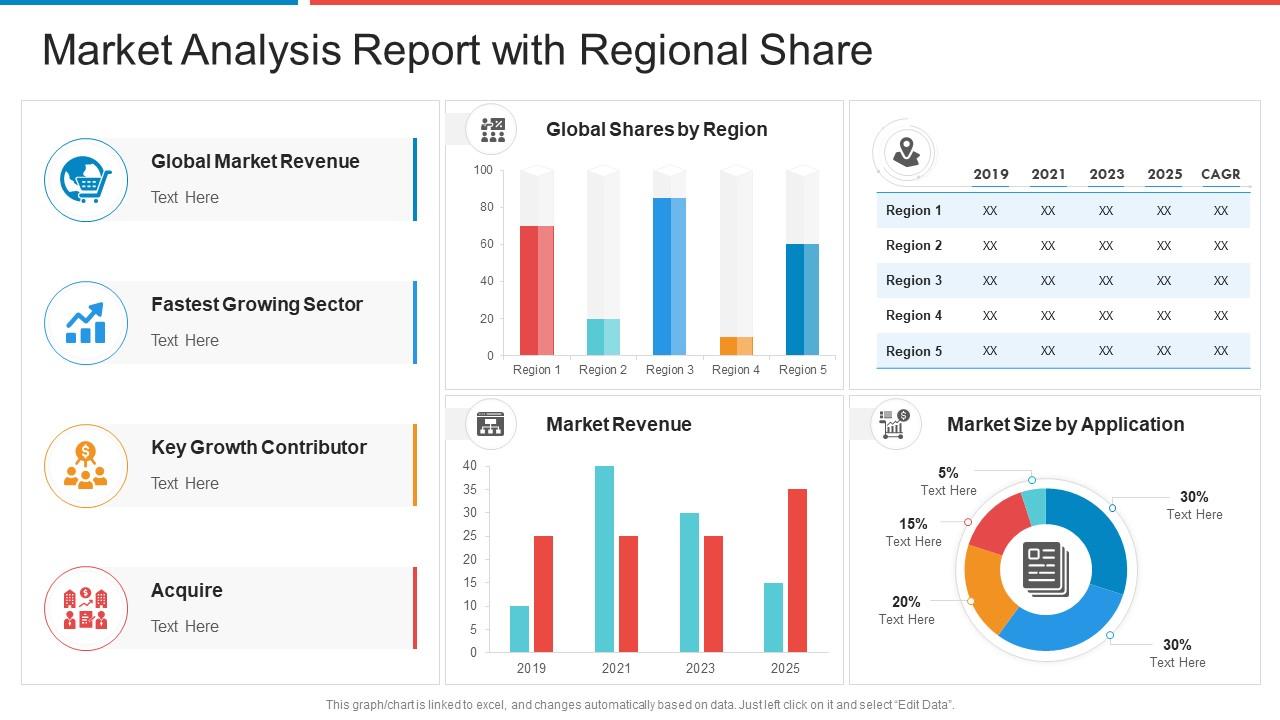
6. Customer and Target-Market Analysis
Customer analysis translates market information into a clearer picture of who buys, why they buy, what problems they experience, and which characteristics influence their decisions.
Useful variables can include demographics, firmographics, behaviors, needs, purchase frequency, decision criteria, preferred channels, perceived barriers, current alternatives, satisfaction, loyalty, and willingness to consider alternatives.
Segmentation should be meaningful rather than decorative. Dividing respondents into groups is useful only when those groups differ in ways that could influence product design, positioning, pricing, sales, service, or marketing decisions.
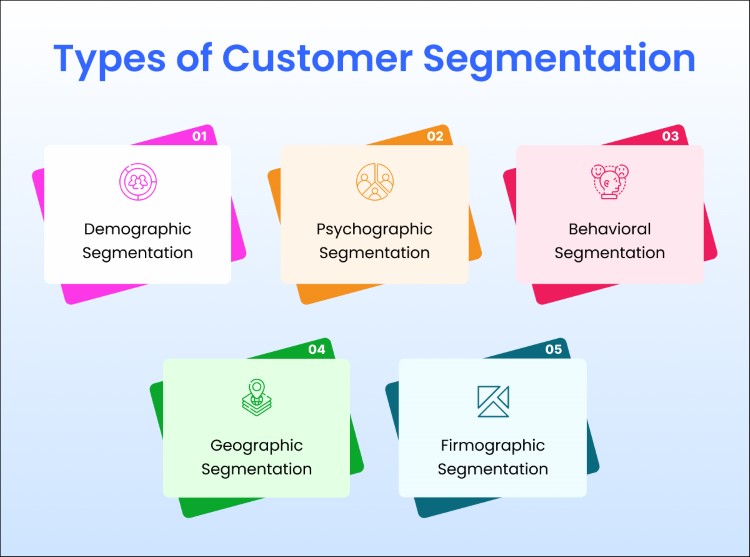
Common segmentation dimensions include demographic, geographic, behavioral, psychographic, and firmographic characteristics. A segmentation framework should state the criteria used and explain why those criteria matter to the business question.
A report template can make segmentation easier by giving each segment a consistent profile: defining characteristics, needs, behaviors, evidence, estimated relevance, barriers, opportunities, and recommended response.
7. Competitive Analysis
Competitive analysis explains where the organization stands relative to alternatives available to customers. Those alternatives may include direct competitors, indirect competitors, substitute products, internal solutions, or the option of doing nothing.
A useful competitor section compares only dimensions that matter to the decision. Depending on the project, these may include price, features, distribution, positioning, customer experience, perceived quality, service model, geographic coverage, technology, or target audience.
Competitive tables are particularly useful when several dimensions must be compared consistently. The template should leave room for evidence and source dates rather than encouraging unsupported claims about competitors.
A competitive positioning matrix can help readers see relationships that are difficult to understand from prose alone. The axes should be based on meaningful customer or market dimensions rather than arbitrary variables chosen simply because they produce a visually attractive chart.
Competitive analysis should also acknowledge uncertainty. Public information may reveal what a competitor offers but not necessarily how customers perceive it, how profitable its position is, or what strategic decisions it will make next.

8. Survey Design and Questionnaire Planning
The questionnaire is upstream of the report. A weak questionnaire can make a polished final document look impressive while leaving the research unable to answer the original business question.
Every important question should have a purpose. Questions may measure awareness, consideration, usage, satisfaction, preference, purchase intent, perceived value, price sensitivity, competitor perception, or unmet needs.
Avoid combining multiple concepts in one question. A respondent may be able to judge price separately from service quality, for example, but a question asking whether a product is “affordable and reliable” makes the resulting answer difficult to interpret.
Answer choices should be mutually understandable and appropriate for the population. Screening questions should remove respondents who do not meet the study requirements before they answer questions that assume relevant experience.
Question order also matters. Earlier questions can influence later responses, so researchers should consider whether introducing a product concept, competitor name, price, or feature list might alter subsequent answers.

9. Data Collection and Quality Control
Data collection should be documented as carefully as the analysis. A report should identify when the research was conducted and provide enough information to understand the conditions under which the evidence was gathered.
For surveys, quality checks may include duplicate-response detection, completion-time review, inconsistent answers, failed screening questions, suspicious response patterns, and missing-value assessment.
For interviews, quality control can involve consistent interview guides, interviewer training, standardized consent procedures, recording or note-taking practices, and systematic coding of themes.
Secondary research requires source-quality checks. Researchers should record publication dates, definitions, geographic coverage, methodology, and any limitations that affect comparability between sources.
The template can include a data-quality subsection where analysts record exclusions, transformations, missing data, unusual observations, and decisions that materially changed the dataset. This creates a defensible trail between raw information and final findings.

10. Data Analysis and Interpretation
Analysis should do more than restate percentages. Its job is to identify patterns, differences, relationships, and implications that help answer the research objective.
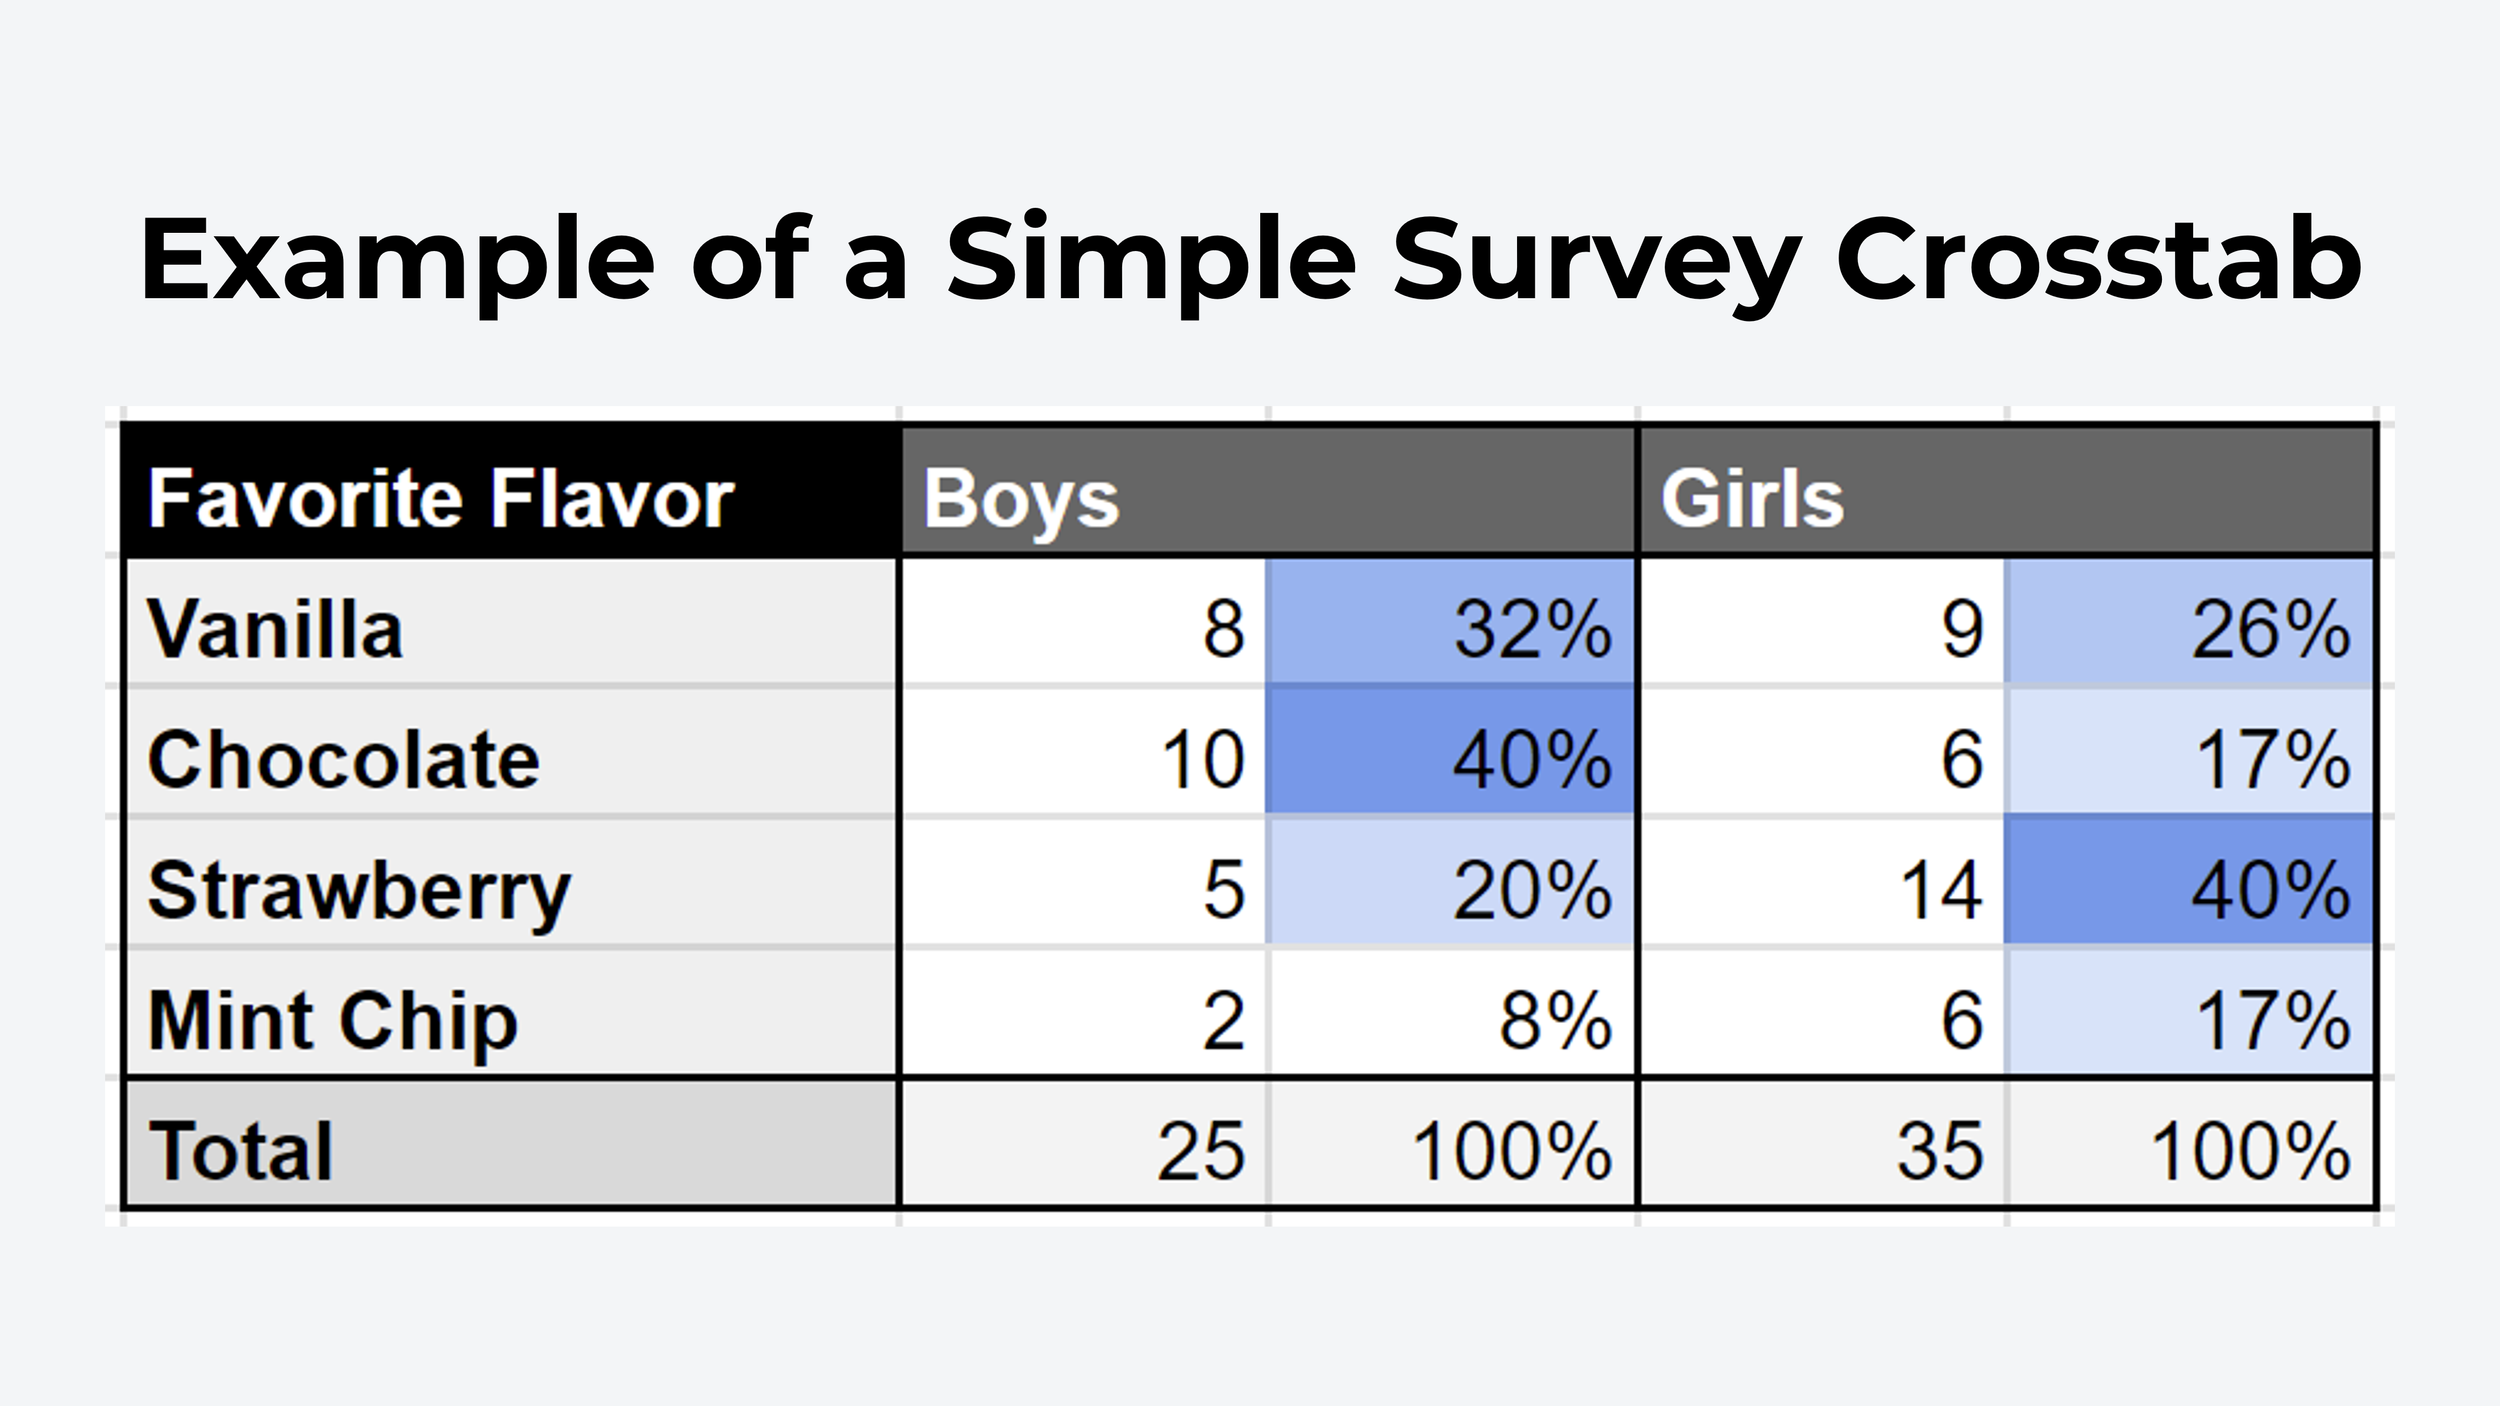
Descriptive analysis may summarize counts, percentages, averages, distributions, rankings, or trends. Segment analysis can reveal differences between customer groups, while cross-tabulation can show how two variables overlap.
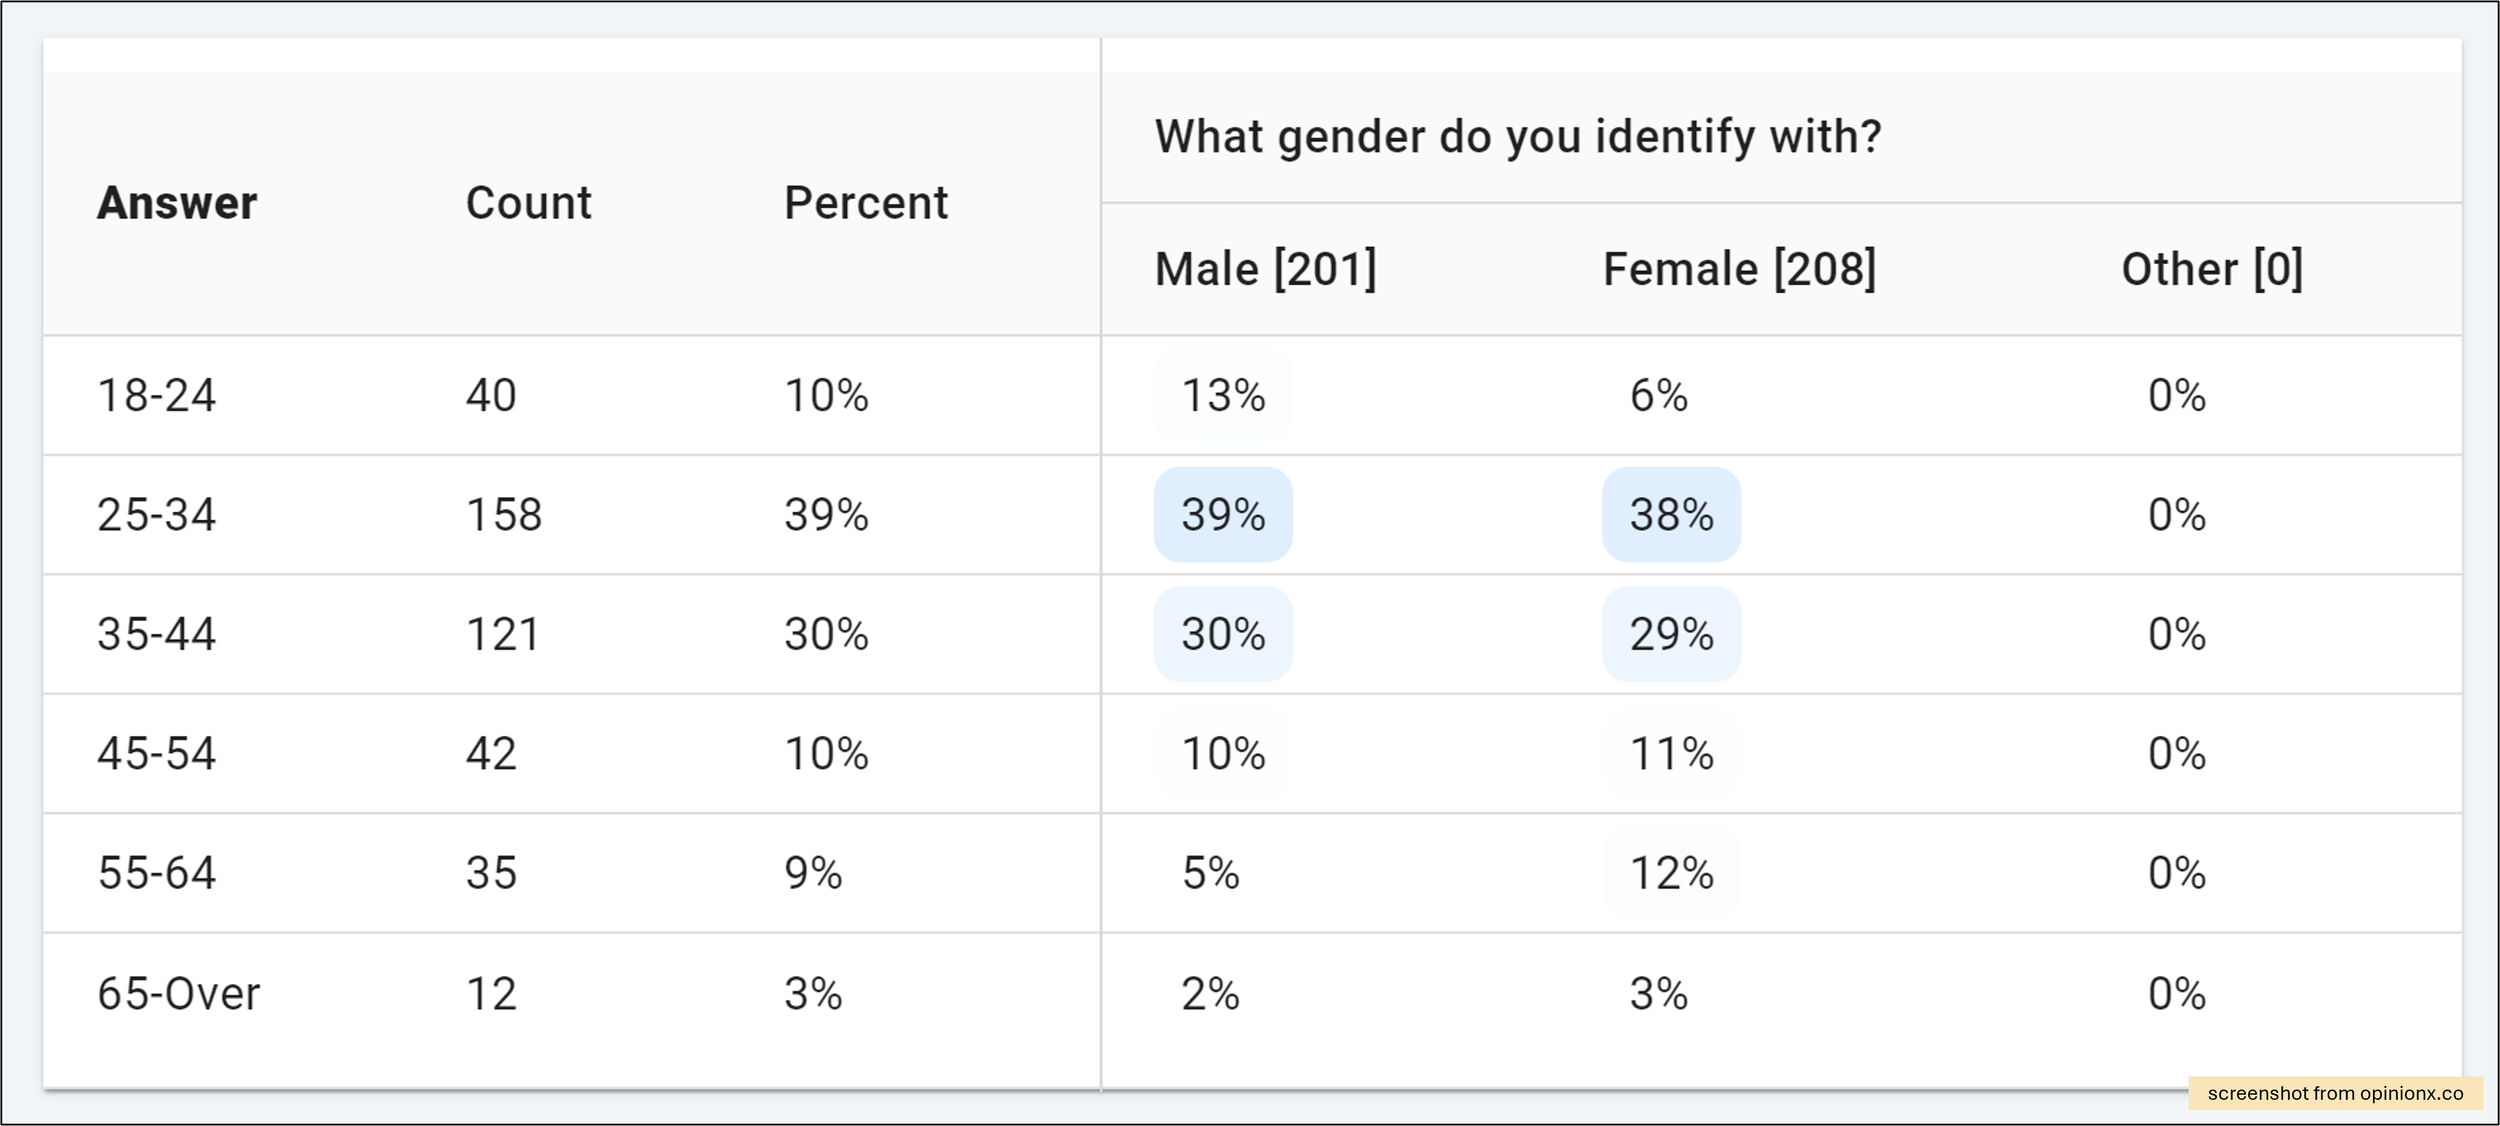
Cross-tabulation is especially useful when an aggregate result could hide meaningful differences between groups. A total preference may look straightforward until the data is separated by customer type, age group, usage pattern, or another relevant variable. :contentReference[oaicite:3]{index=3}
Interpretation should be separated from observation. “Segment A selected the feature more often than Segment B” is an observation if supported by the data. “Segment A therefore values convenience more strongly” is an interpretation that requires a reasonable basis.
Statistical significance, confidence intervals, sample size, effect size, and practical significance should be considered where appropriate. A difference can be statistically detectable yet too small to matter commercially, while a meaningful business difference may deserve attention even when a small sample limits formal statistical certainty.
11. Data Visualization
Charts should answer questions, not merely decorate pages. A good visualization helps a reader recognize a comparison, trend, distribution, relationship, or composition quickly.
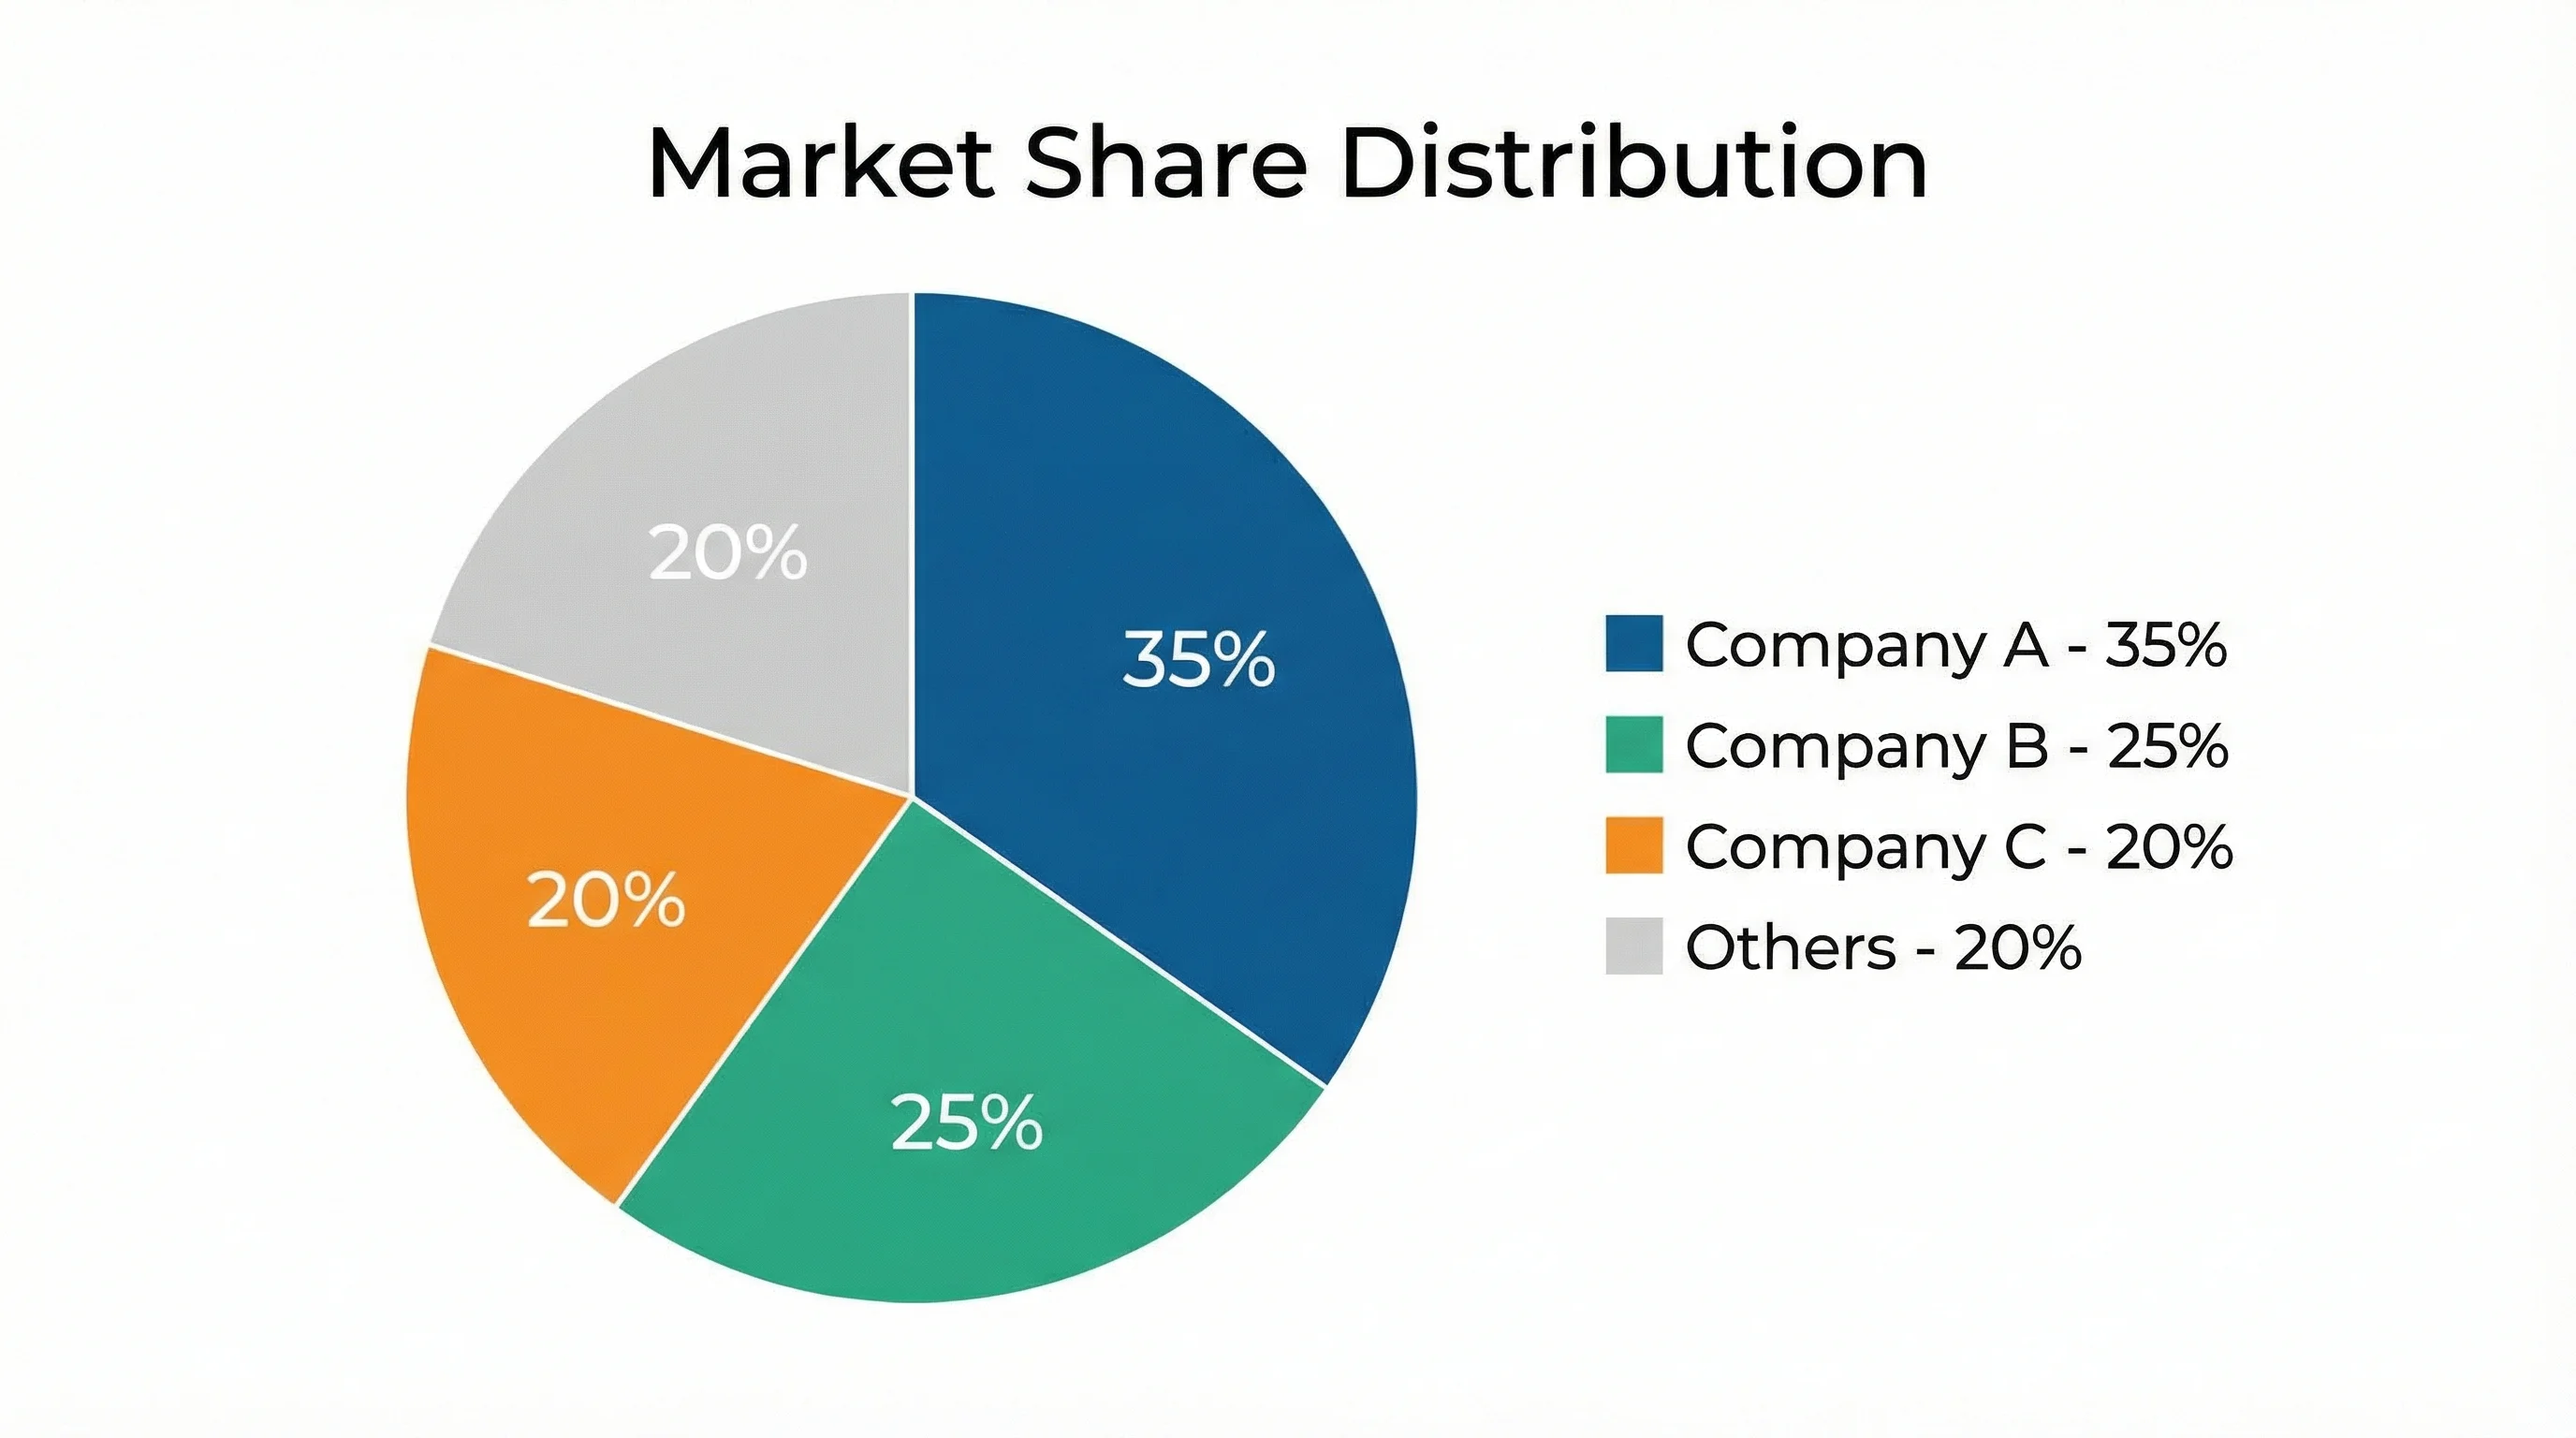
Bar charts are useful for comparing categories. Line charts are often effective for showing changes over time. Pie or donut charts can work for simple parts-of-a-whole comparisons when there are only a small number of meaningful categories.
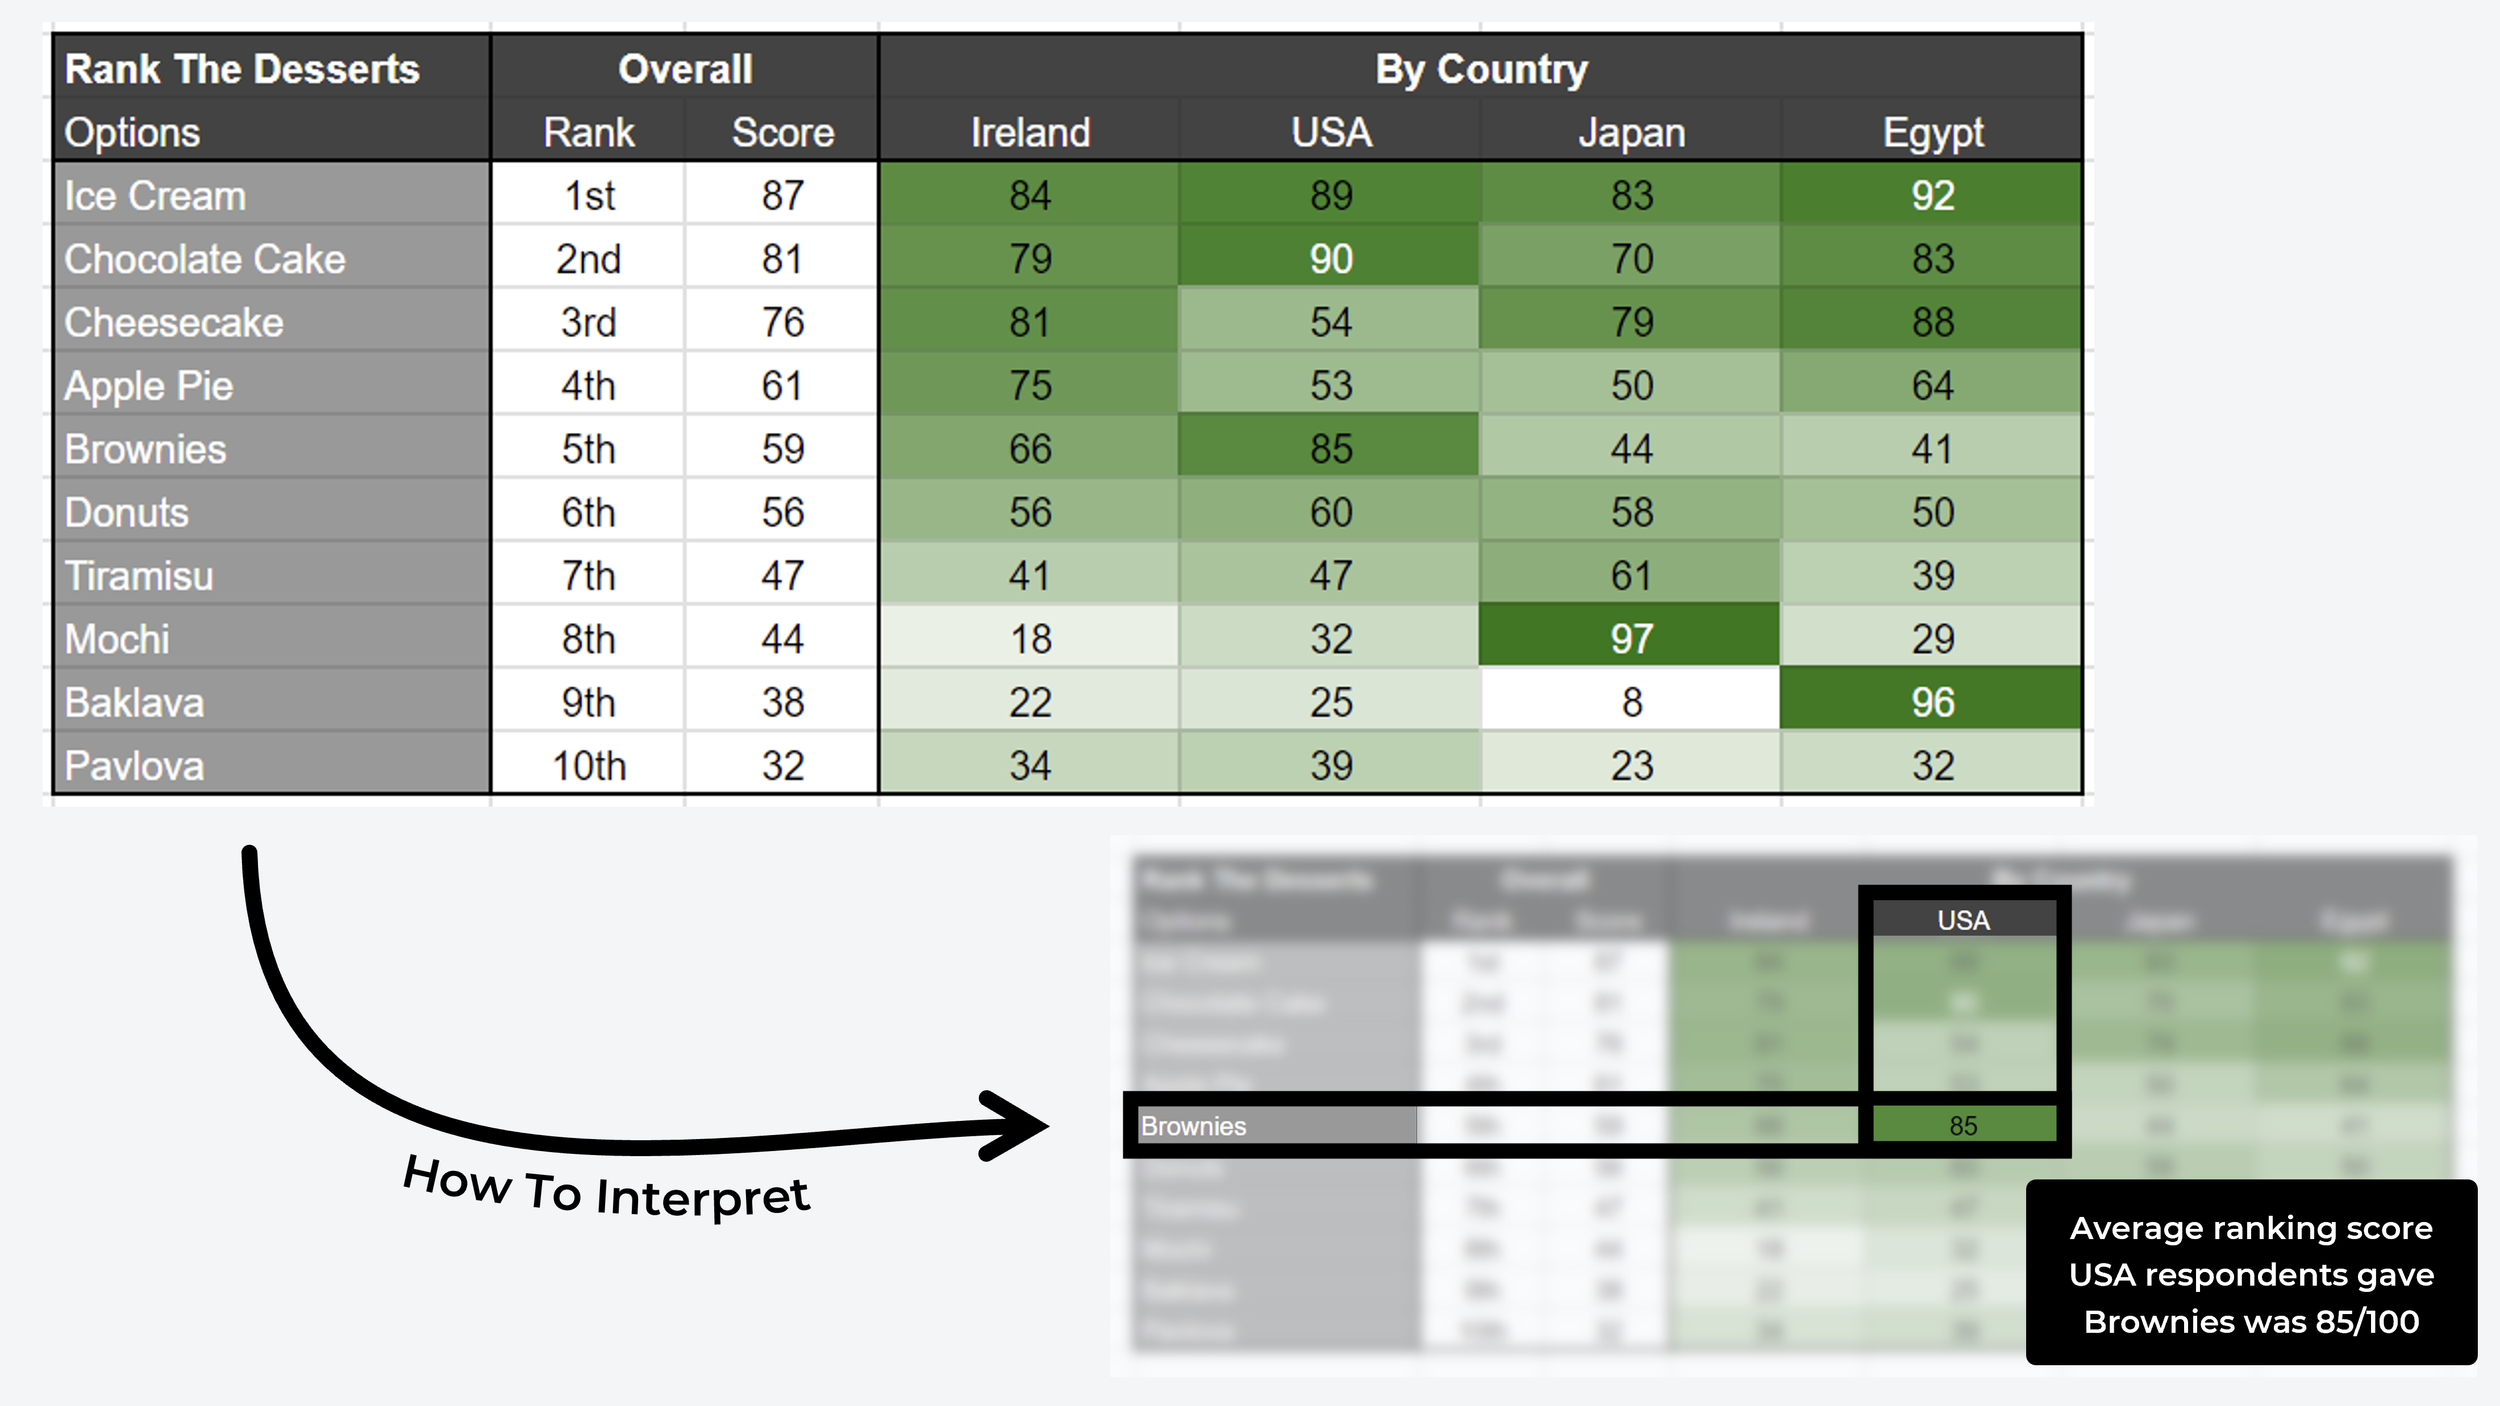
Tables are valuable when exact values matter or when readers need to compare several dimensions simultaneously. They should not be replaced by charts simply because charts appear more visually sophisticated.
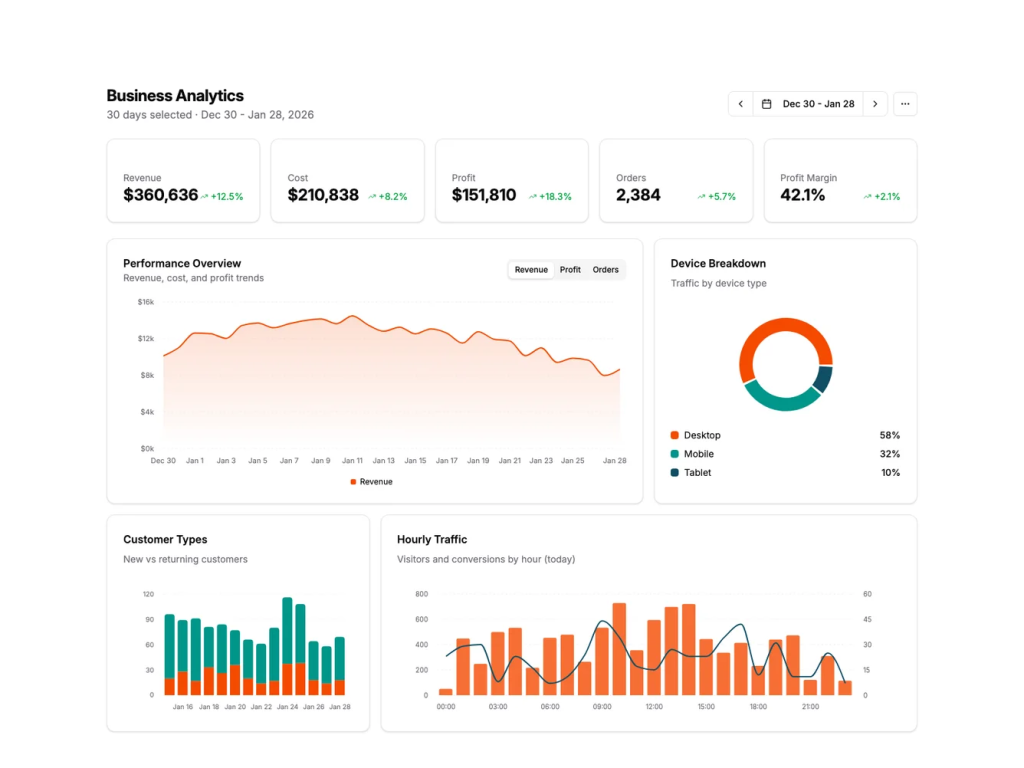
Dashboard-style reporting can help analysts examine incoming data, filter by segment, compare responses, and identify patterns before the final report is written. Reporting guidance also emphasizes selecting visualization types that match the analytical question. :contentReference[oaicite:4]{index=4}
Every chart should have a clear title, identifiable units, an understandable scale, and enough context for interpretation. Avoid unnecessary 3D effects, excessive colors, truncated axes that distort comparisons, and labels that require the reader to search elsewhere for their meaning.
12. Findings and Key Insights
The findings section is where the report begins to tell the story of the research. Organize findings around themes or decisions rather than copying the order in which questions appeared in the survey.
Each major finding should answer three questions: what did the evidence show, how strong is the evidence, and why does it matter?
A useful finding title is insight-led. Instead of “Question 12 Results,” a stronger heading might say “Price remains a major barrier among high-frequency users,” provided the underlying evidence actually supports that statement.
Evidence should appear close to the claim it supports. If a paragraph makes a conclusion based on a chart, the reader should not have to search several pages later to determine where the conclusion came from.
Do not overload the report with every result. Detailed response tables can remain in the appendix while the main narrative concentrates on findings that influence the decision.
13. Recommendations and Action Planning
Recommendations are the point where research becomes useful to the organization. They should not simply repeat the findings. They should explain what should change because of those findings.
A practical recommendation can follow a simple pattern: action, reason, evidence, owner, timing, and success measure. This makes it easier to move from a research report into an operating plan.
For example, a hypothetical recommendation might be: “Prioritize the mid-market segment for the next product campaign because research indicates stronger purchase consideration and a clearer unmet need in that group.” The supporting data would then be referenced directly in the findings section.
Recommendations should be prioritized. A list of fifteen equally urgent actions usually communicates that nothing has been prioritized. Rank recommendations by potential impact, confidence, feasibility, cost, urgency, or strategic importance.
Where evidence is uncertain, recommendations can include a validation step. Instead of pretending the research proves an answer that it does not, the organization can run a pilot, test a price, conduct additional interviews, or measure behavior before making a larger commitment.

14. Appendices and Supporting Evidence
Appendices keep the main report readable while preserving the evidence needed by analysts, reviewers, auditors, or stakeholders who want additional detail.
Typical appendices can include the questionnaire, interview guide, detailed sampling information, data tables, statistical outputs, source lists, competitor screenshots, coding frameworks, definitions, calculation notes, and technical methodology.
The appendix should be referenced from the main text when relevant. A reader should understand why a supporting table exists and which finding or methodology point it supports.
Raw data should be handled carefully. Personal information, confidential business information, proprietary research materials, or restricted datasets should not be exposed simply because an appendix exists.
Version control also matters. If a report changes after publication, the organization should be able to determine which dataset, assumptions, and analytical version produced the reported findings.
15. Choosing the Right File Format
The content should remain consistent even when the presentation format changes. Word is often convenient for narrative-heavy reports because sections, tables, comments, and revisions are easy to manage.
PDF is generally better for a finalized distribution copy because it preserves the intended page structure across devices. It is useful when the report is being circulated to executives, clients, boards, investors, or other stakeholders who should see a stable version.
Excel is especially useful when the report depends heavily on structured tables, calculations, scenario analysis, survey summaries, or datasets that need to remain interactive. An Excel workbook can contain a report dashboard alongside supporting calculations.
Google Docs is useful for collaborative narrative drafting, comments, review workflows, and shared editing. Google Sheets is useful when several people need to work with tabular data, formulas, filters, or charts in a shared environment.
The best format is therefore determined by how the report will be created, reviewed, analyzed, distributed, and updated. A final PDF may coexist with an editable Word or Google Docs working document and an analytical Excel or Google Sheets workbook.
How to Create a Market Research Report Template From Scratch
Start with the decision, not the document design. Write one sentence describing what the research should help the organization decide or change.
Next, list the evidence required to answer that decision. Separate primary evidence, secondary evidence, internal data, competitive observations, and assumptions so that the final report does not blur fundamentally different types of information.
Create the report outline before building the questionnaire. This reverse process makes it easier to identify which questions belong in the research and which are interesting but unlikely to influence the decision.
Build reusable fields for project information, objectives, methodology, sample, sources, findings, limitations, recommendations, and appendices. Then create optional modules for market sizing, segmentation, competitive analysis, pricing, product testing, customer satisfaction, or forecasting.
Finally, test the template with a real project. A template that looks logical on paper can become awkward when populated with real charts, long findings, source notes, caveats, and stakeholder comments. Revise the structure after each meaningful project rather than treating the first version as permanent.
Market Research Report Template Excel: When a Spreadsheet Works Best
A spreadsheet-based report is particularly useful when the research contains substantial structured data. It can combine raw or cleaned responses, calculations, pivot tables, charts, segment summaries, and a management dashboard in one workbook.
Keep the raw-data layer separate from calculations and presentation. This prevents accidental changes to source records from propagating through the analysis without being noticed.
Use named worksheets or a predictable structure such as “Read Me,” “Raw Data,” “Data Dictionary,” “Calculations,” “Segments,” “Charts,” and “Executive Summary.” The exact names can vary, but the separation of responsibilities makes the workbook easier to audit.
Excel templates can also be useful for scenario analysis. A market-entry model, pricing study, or demand assessment can allow assumptions to be changed while keeping calculations visible and reproducible.
The main weakness of spreadsheet reporting is narrative depth. If stakeholders need extensive explanation, methodology, interpretation, and recommendations, the spreadsheet should usually support a separate narrative report rather than replace it entirely.
Market Research Report Template Word: When Narrative Matters
Word is a strong choice when the report contains substantial explanation alongside charts and tables. It supports a conventional report structure and is familiar to many organizations.
A Word template should use consistent heading levels, table formatting, page numbering, captions where appropriate, and a predictable system for figures and appendices.
Do not make every page identical. A methodology page, data table, executive summary, and recommendation page serve different purposes and should be designed around readability rather than rigid visual repetition.
Word also works well for review workflows. Stakeholders can comment on individual findings, request revisions, challenge assumptions, and approve recommendations without changing the underlying analytical workbook.
For recurring reports, use fields or controlled placeholders for dates, project names, authors, version numbers, and report status. This reduces manual errors when the same structure is reused across multiple studies.

Market Research Report Template Google Docs and Google Sheets
Google Docs is particularly useful when research teams need simultaneous collaboration. Researchers, marketers, product managers, executives, and external partners can review the same working document without maintaining multiple emailed versions.
Google Sheets can complement it by holding the structured data and calculations behind the report. Charts can then be copied or connected to the narrative document while the underlying dataset remains available for deeper review.
Collaboration requires governance. Decide who can edit, who can comment, who approves findings, and which version becomes the final record. A shared document without ownership can become difficult to control as more reviewers contribute.
Keep source notes close to important data. A sheet should make it possible to understand where a value came from, what date it represents, and whether it is an observed value, an estimate, or an assumption.
For recurring research, establish a master structure and duplicate it for each new project rather than editing the previous report in place. This helps preserve historical versions and reduces the chance of carrying old findings into a new study.

Market Research Report Template PDF: When to Use a Fixed Version
PDF is most useful when the report has reached a stable publication stage. It gives stakeholders a consistent representation of page layout, charts, tables, and headings.
A PDF should normally be exported from an editable source rather than treated as the primary analysis environment. The editable version remains useful when a reviewer identifies an error or when new research needs to be incorporated.
Before exporting, check page breaks, chart readability, table overflow, font rendering, hyperlinks if present, appendix references, and document metadata.
Long reports benefit from bookmarks or a well-designed table of contents. Short reports may need only clear headings and page numbers, but the navigation should still make the document easy to scan.
If a PDF is being used as the official record, identify the reporting period and version clearly. This prevents an older document from being mistaken for the latest analysis.

Free Market Research Report Templates: What to Look For
A free template can be perfectly adequate when the project is straightforward. The key question is not whether the template costs money but whether its structure matches the research problem.
Before using a free template, check whether it includes the sections you need, whether the file can be edited in your preferred application, whether the design is readable, and whether its terms allow the intended use.
Do not assume that a page advertised as “free” means every associated asset, chart, icon, or premium feature is also free. Verify the actual access conditions before building a production workflow around a resource.
Free templates are particularly valuable for learning structure. Even if a team eventually creates its own branded framework, reviewing several established formats can reveal useful ways to organize methodology, findings, recommendations, and appendices.
The goal is not to find the prettiest free template. The goal is to find a structure that makes research easier to conduct, easier to audit, easier to explain, and easier to turn into action.

Common Market Research Report Mistakes
One common mistake is beginning with a template before defining the decision. The document then determines the research rather than the research determining the document.
Another problem is confusing data with insight. A table of survey percentages is evidence, but the report must explain the meaningful pattern and why it matters.
Overstating conclusions is equally dangerous. If the research identifies an association, do not automatically describe it as causation. If respondents say they intend to purchase, do not present that statement as guaranteed future behavior.
Reports can also become too long because analysts include every available result. Detail belongs where it helps the decision. Supporting evidence can remain in appendices while the main report emphasizes the findings that matter.
Finally, recommendations may fail when they are disconnected from evidence. Each important action should have a visible relationship to a finding, and the report should acknowledge when an action requires further validation.
Best Practices for a Professional Report
Use a decision-first structure. Every major section should contribute to answering the central business question.
Separate findings from interpretation. This improves transparency and lets readers challenge an inference without questioning the underlying evidence.
Show methodology without overwhelming the main narrative. Readers need enough information to judge credibility, while technical detail can be moved into an appendix when appropriate.
Make visuals self-explanatory. A reader should understand the comparison, population, period, and units without searching several pages for missing context.
Keep recommendations specific. “Improve marketing” is weak. A stronger recommendation identifies the action, target, rationale, evidence, priority, and expected outcome.
How a Market Research Report Template Can Support Different Research Projects
A customer satisfaction study might emphasize respondent profile, satisfaction measures, drivers, verbatim comments, segment differences, and service recommendations.
A product concept study might emphasize awareness, concept appeal, feature priorities, perceived differentiation, purchase intent, objections, and recommended changes to the product proposition.
A pricing study might require price-sensitivity questions, competitive price benchmarks, willingness-to-pay analysis, perceived value, and scenario comparisons.
A market-entry report might require market sizing, geographic analysis, customer segmentation, competitor mapping, channel analysis, barriers to entry, risk assessment, and entry recommendations.
A recurring industry report might emphasize trend tracking, consistent definitions, historical comparisons, market indicators, competitive changes, and a clearly defined refresh schedule.
Practical Solution
The most practical way to implement a market research report template is to create a modular system rather than one oversized document. Start with a core template containing the title page, executive summary, objectives, methodology, findings, recommendations, limitations, and appendix.
Add optional modules for market sizing, customer segmentation, competitor analysis, pricing, product testing, survey analysis, qualitative interviews, forecasting, and geographic analysis. This keeps small studies concise while allowing larger projects to use the same underlying framework.
Build a research-to-report map before fieldwork starts. For every important research question, identify the data source, analysis method, intended report section, decision it informs, and evidence needed to support the eventual recommendation.
During analysis, maintain a findings register with columns for finding, evidence, source, confidence, implication, and recommended action. This simple working table can dramatically reduce the effort required to write the final narrative because the relationship between evidence and action is already documented.
Before publication, perform a structured quality review. Verify calculations, source dates, sample descriptions, chart labels, definitions, recommendations, limitations, and version information. Then ask an independent stakeholder to read only the executive summary and recommendations and explain what decision they believe the report supports.
Market Research Report Template DoD Considerations
Government acquisition research requires additional care because a general business template should not automatically be presented as an official government requirement. The Department of Defense has published specific market research guidance for documenting acquisition-related research.
The DoD’s 2017 Market Research Guide describes a common framework for conducting and documenting market research supporting acquisition of services. It states that the report template covers general requirement information, detailed market and industry analysis where appropriate, and conclusions and recommendations. :contentReference[oaicite:5]{index=5}
The guide also emphasizes that the amount of research should be tailored to the acquisition. Factors such as urgency, estimated value, complexity, and previous experience can affect the appropriate scope.
Current DoD acquisition guidance also addresses documenting methods used to conduct market research, the timeframe, analysis of potential sources, and conclusions reached from the analysis. :contentReference[oaicite:6]{index=6}
Therefore, anyone searching for a market research report template dod should distinguish between an unofficial generic template and the applicable current DoD guidance or acquisition-specific documentation. A generic template can help organize thinking, but it should not be represented as an official requirement unless the applicable authority confirms that status.
Reference Examples
The following examples are visual references for the exact resource phrases requested. Availability, licensing, editing rights, and download conditions should be checked on the original source before using any resource commercially.
market research report template dod
Source: Venngage
market research report template pdf
Source: Visme
market research report template free download
Source: Visme
market research report template excel
Source: SlideTeam
market research report template free
Source: ReveChat
market research report template word
Source: Venngage
market research report template google docs
Source: Venngage
market research report template google sheets
Source: Tailkits
market research report template download
Source: Venngage
Frequently Asked Questions
What should a market research report template include?
A practical market research report template should normally include an executive summary, research objectives, methodology, market overview, target-market analysis, competitive analysis, findings, recommendations, limitations, and appendices. The exact sections should be scaled to the research question rather than copied mechanically.
What is the difference between a market research report and a market analysis?
A market analysis usually describes the broader market, including size, structure, trends, competitors, and external conditions. A market research report is generally tied to a specific research project and uses collected evidence to answer a defined business question and support a decision. A market analysis can therefore be one section of a larger research report. :contentReference[oaicite:7]{index=7}
Should I use a market research report template Word file or PDF?
Use Word or another editable format while the report is being drafted and reviewed. Use PDF when you need a stable final version for distribution. Many teams maintain both versions so that the editable source remains available for future revisions.
Can a market research report template be used in Google Docs?
Yes. A Google Docs version is useful for collaborative writing, comments, review, and shared editing. The underlying structure should remain focused on the research objective rather than the software used to create the document.
Can Excel be used for a market research report?
Yes. Excel is particularly useful when the research includes structured datasets, calculations, segmentation, pivot tables, scenario models, and dashboards. For narrative-heavy research, it is often better used alongside a Word, PDF, or Google Docs report.
What makes a free market research template useful?
A useful free template provides a sound structure, editable sections, readable formatting, and enough flexibility for the research problem. It should not force unnecessary sections into a report simply because they are included in the template.
How long should a market research report be?
There is no universal page count. A focused customer study might be relatively short, while a market-entry or strategic research project may require substantially more detail. The report should be long enough to establish credibility and support the decision without burying the important findings.
Should recommendations appear in the executive summary?
Yes, when the report is intended for decision-makers. The executive summary should normally communicate the most important findings and the actions they support, while the body of the report provides the evidence and reasoning behind those recommendations.
How should I handle limitations?
State limitations clearly and explain their practical effect. A limitation is useful when it tells readers how much confidence they should place in a conclusion and what additional research could reduce uncertainty.
How do I keep a template from becoming too rigid?
Use a modular design. Keep a small group of mandatory core sections and create optional modules for specialized research questions. This preserves consistency without forcing every project into the same shape.
Conclusion
A strong market research report template does more than make a report look professional. It creates a repeatable bridge between a business question, research design, evidence, analysis, and action. The most effective template is therefore decision-first, evidence-led, transparent about limitations, and flexible enough to accommodate different research methods and file formats.
